SST vs. buoy
SST vs. sat.
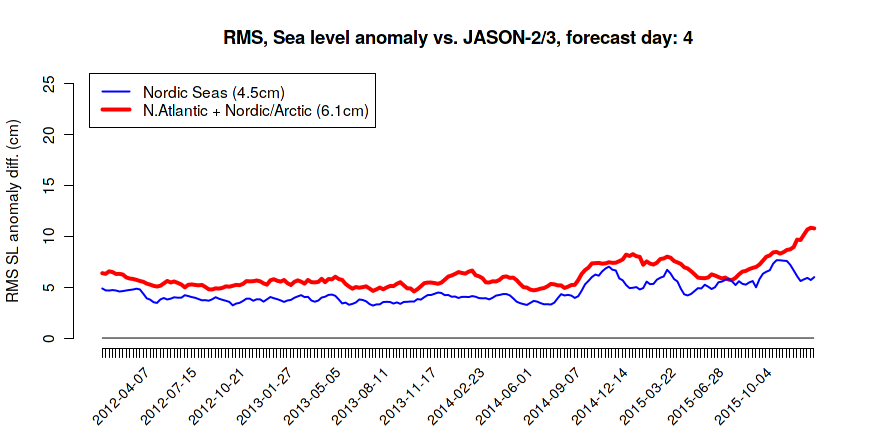
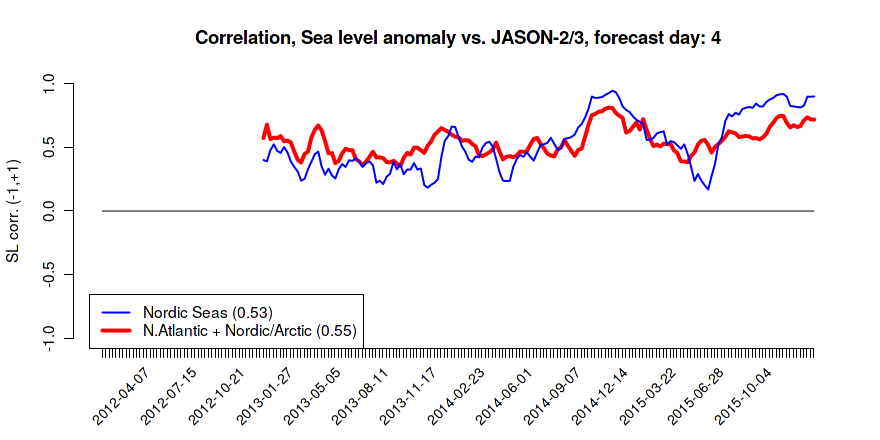
SL anomaly
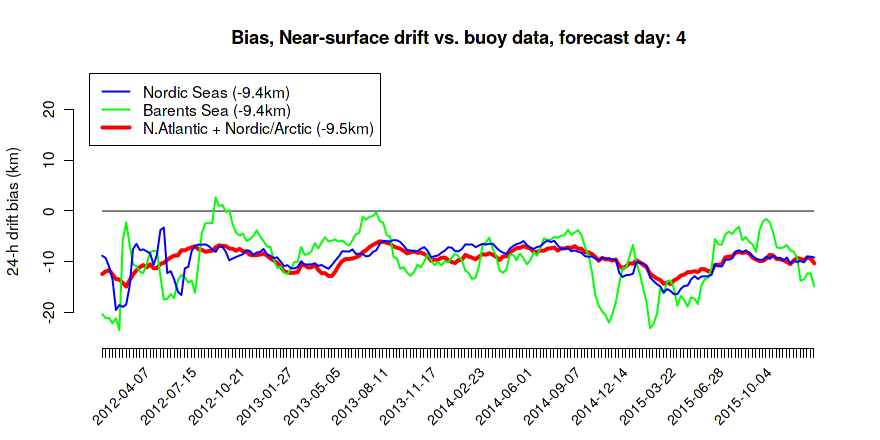
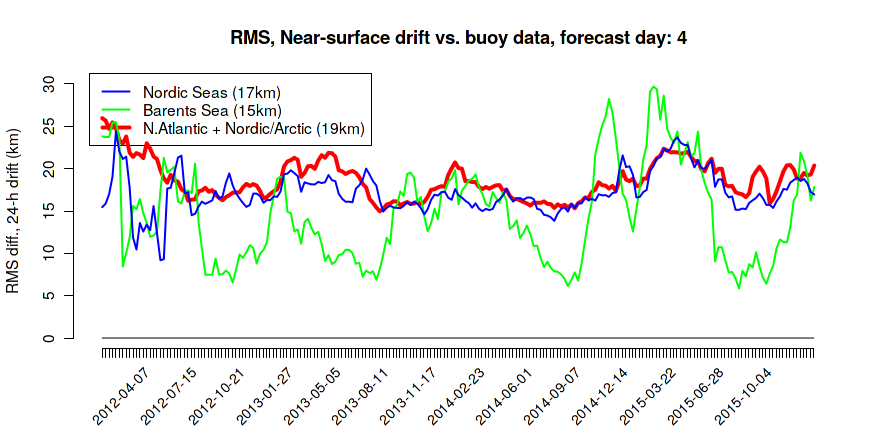
drift vs. buoy
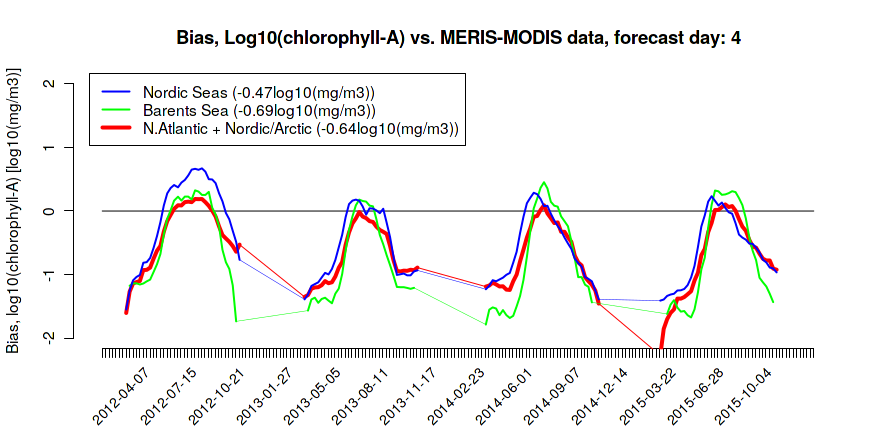
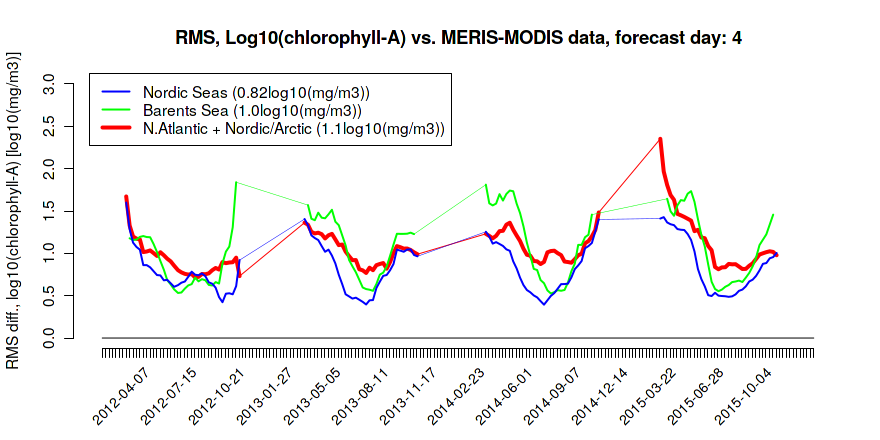
chlorophyll a
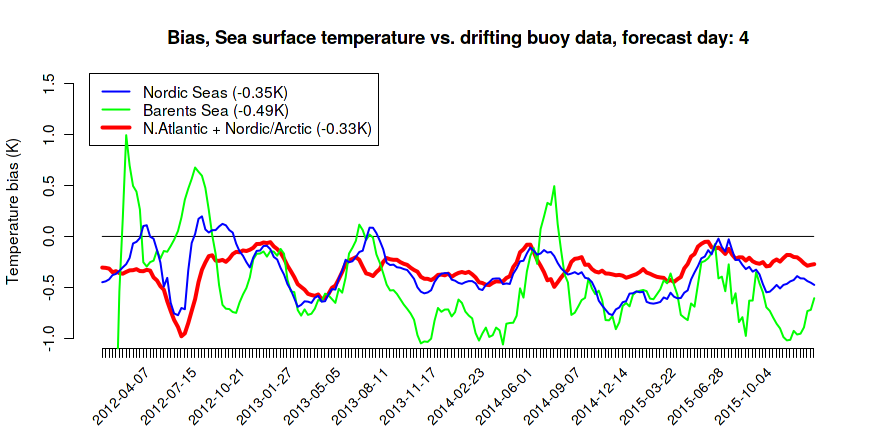
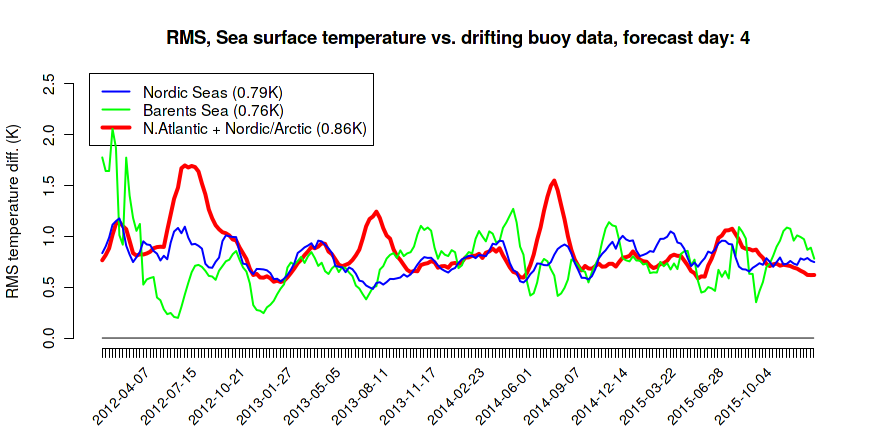
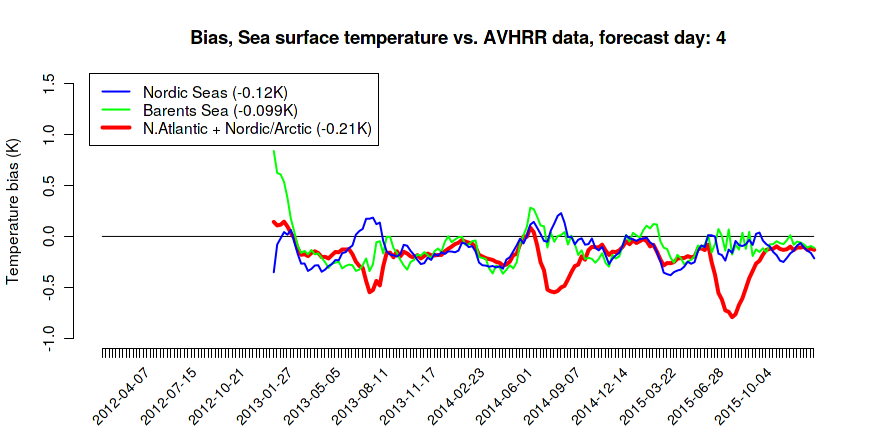
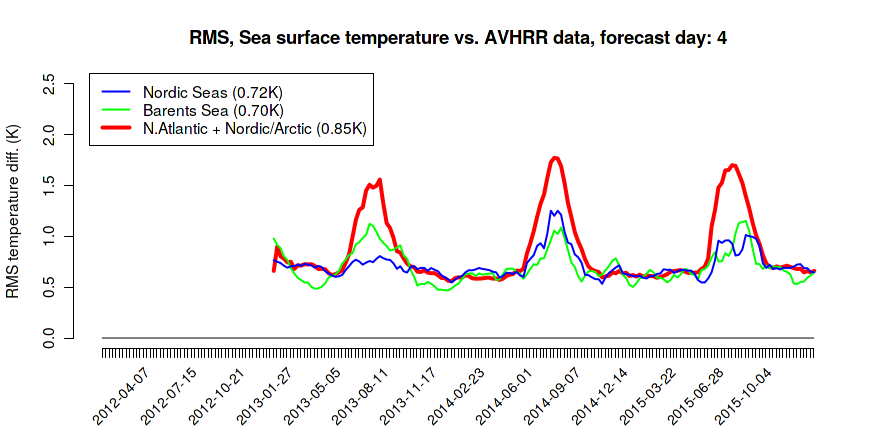
Time series of validation results for the ocean surface
Results below are for the daily average for the 3rd day after the day when the bulletin was issued. The bulletin date is given as the x-axis coordinate in the images below. Average values for the time series that are displayed, are given in parenthesis in the line label legend.
The AATSR product was discontinued in April 2012 due to the loss of Envisat.
Sea surface temperature vs. buoy data
Information on validation data, methods, regions, and model results
Sea surface temperature vs. satellite data
Information on validation data, methods, regions, and model results
Sea level anomaly vs. satellite data
Information on validation data, methods, regions, and model results
Near-surface drift vs. buoy data
Information on validation data, methods, regions, and model results
Log10(chlorophyll-A) vs. satellite data
Information on validation data, methods, regions, and model results
Generated by /metno/routine/sms/V2/timeSeries/validationTimeSeries.sh Fri Jan 1 12:42:28 UTC 2016 on arcmfc