V0-V1 Validation Results
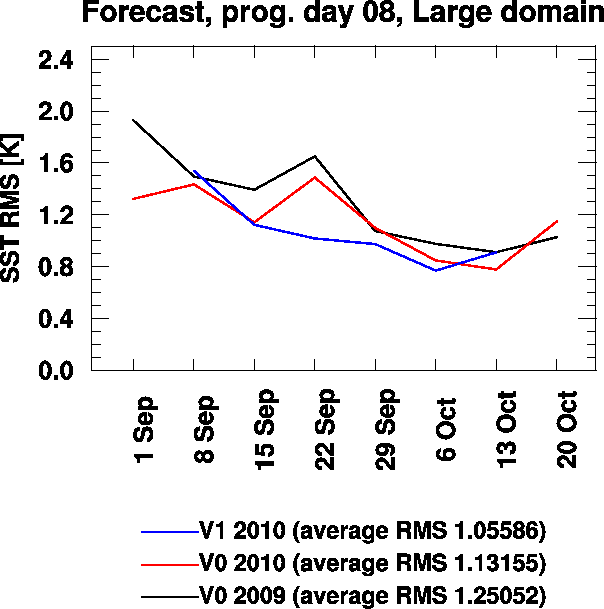
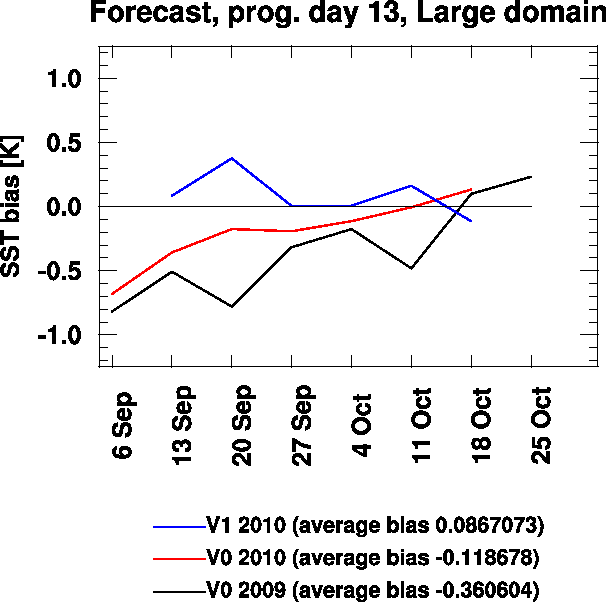
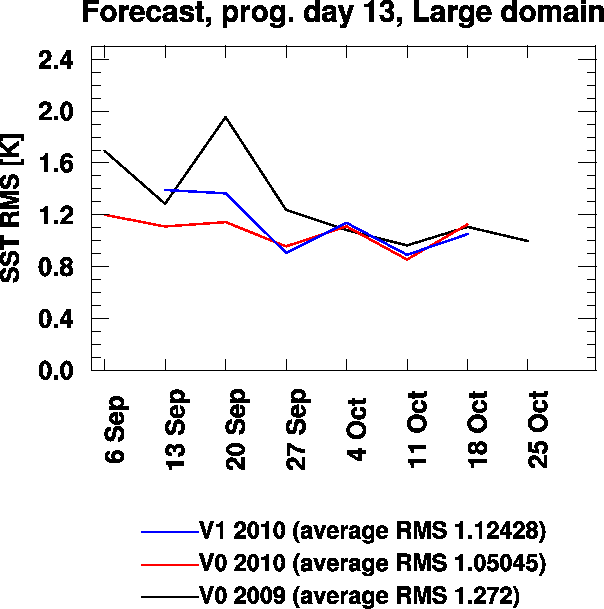
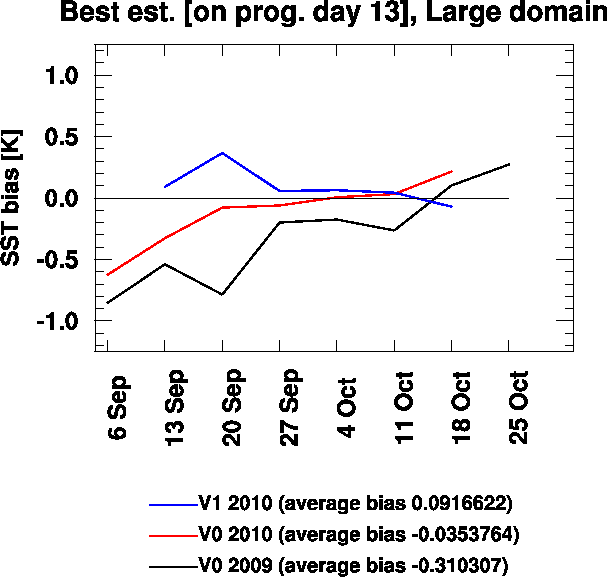
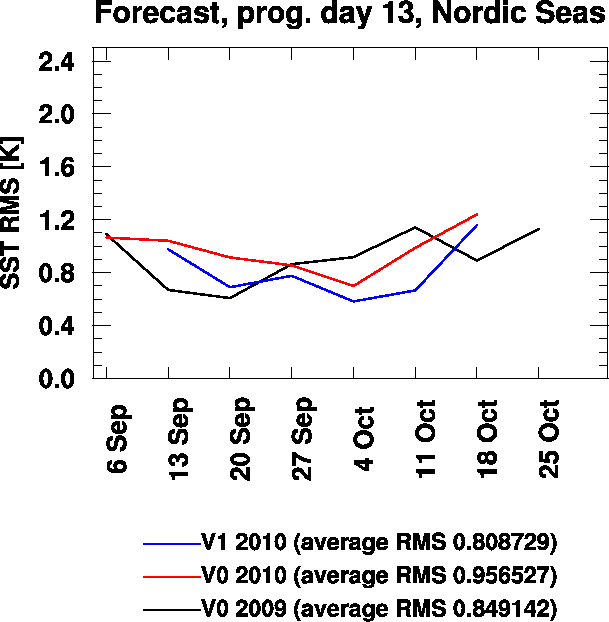
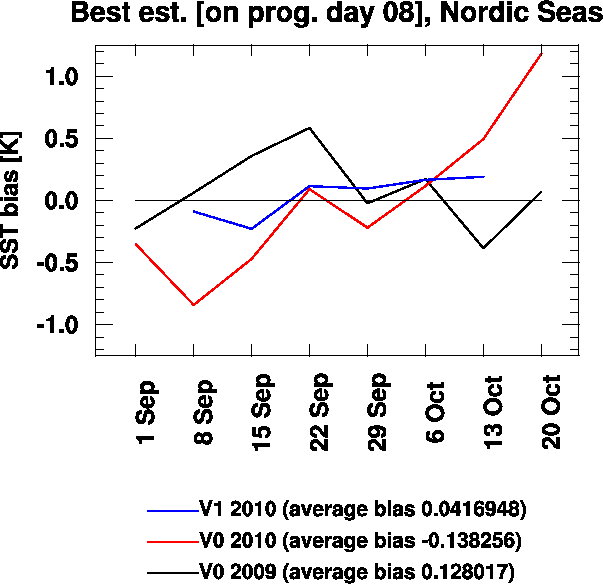
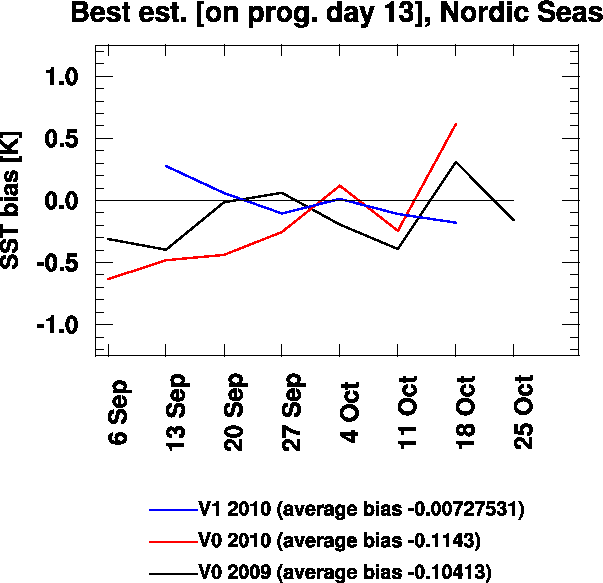
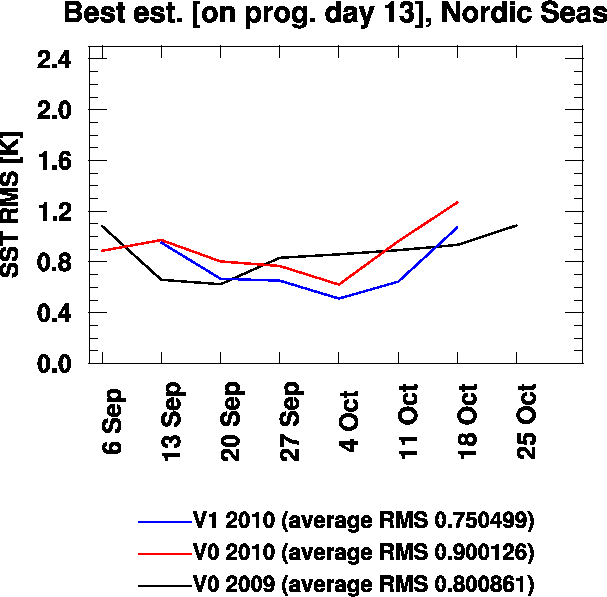
Images in this page display validation results for various myOcean/TOPAZ versions.
The validation is performed using model results from September and October 2009 and 2010, and observations for the same periods obtained from the SST TAC via IFREMER (the AATSR product).
2009 results are included as a reference, since V0 has gradually transitioned towards V1 in the period from Sep/Oct 2009 to Sep/Oct 2010.
Results are made available for forecast day no. 8 (the bulletin date), and forecast day no. 13.
Results from the merged weekly 100-member ensemble product are also included, as "best estimate" (BE). The BE for forecast day no. 8 is the 1st day in the ensemble run, while forecast day no. 13 is the 6th day.
The legends also include average values for the mutual period where results from all time series are available.
'bias' is the bias of model values - observations (alternative: 'RMS')
'Large' domain:
The domain between 50N and 80 N, excluding the North Sea and the Baltic (observations are masked), and the Pacific Ocean (no model results)
| Forecast product, day 8 (relative to the time of the analysis) | |
|---|---|
| Bias | RMS |

| 
|
| Forecast product, day 13 (relative to the time of the analysis) | |
|---|---|
| Bias | RMS |
| 
|
| Best estimate product, day 8 (relative to the time of the analysis) | |
|---|---|
| Bias | RMS |

| 
|
| Best estimate product, day 13 (relative to the time of the analysis) | |
|---|---|
| Bias | RMS |
| 
|
'NordicSeas' domain:
The green region on the map, see Regions
| Forecast product, day 8 (relative to the time of the analysis) | |
|---|---|
| Bias | RMS |
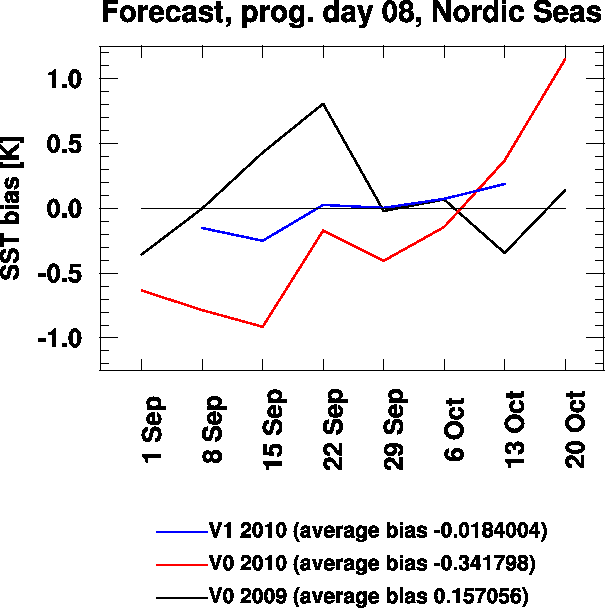
| 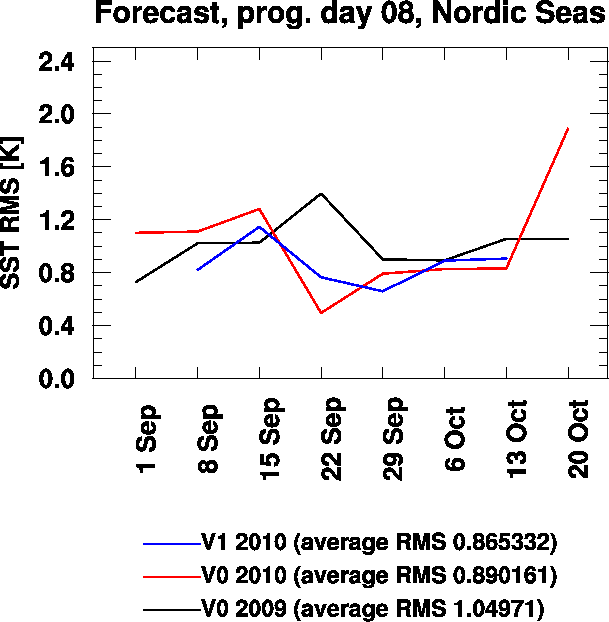 |
| Forecast product, day 13 (relative to the time of the analysis) | |
|---|---|
| Bias | RMS |
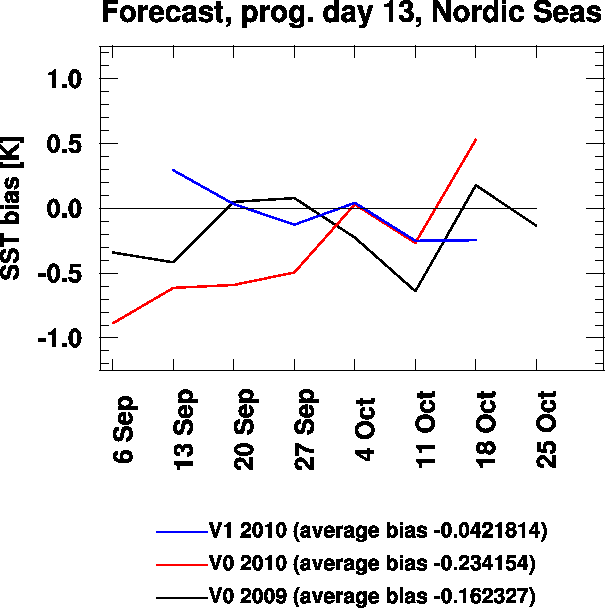
| 
|
| Best estimate product, day 8 (relative to the time of the analysis) | |
|---|---|
| Bias | RMS |
| 
|
| Best estimate product, day 13 (relative to the time of the analysis) | |
|---|---|
| Bias | RMS |
| 
|