Validation time series
Time series of validation results for forecast lead times
Here are links to time series of aggregated validation results for the various forecast lead times. "Day 1" is the bulletin date. See below for a detailed description. These products are available for the ARC MFC V3 product, from 2023-09 onwards.
Description
NOTE! This description is copied from the V2 validation pages, as the explanation is unchanged. Hence, dates in the example are for days that precede the V3 production, which started in 2023-09.
|
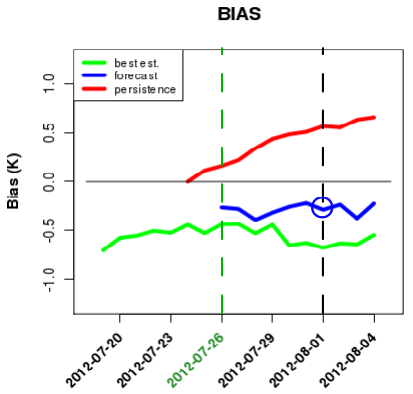
Below is a sample of validation results from weekly bulletins (sea surface temperature vs. drifting buoy data; "Extended domain"/"N. Atlantic + Nordic/Arctic"). The sample bulletin date (2012-07-26; corresponding to "Day 1" in the list above) is printed in green at the horizontal axis. |
||

|
The bulletin date is further indicated by a green vertical dashed line. Time series results that are given here, are only computed for the forecast product (blue curve). There are tick lines for every three days on the horizontal axis. Note that the week day at which the validation analyses have been performed, changed from Wednesdays to Thursdays in May/June 2012 (the first Thursday bulletin is 2012-06-07). More importantly, the time analysis of analysis was shifted from bulletin - 7 days prior to June 2012, to bulletin - 3 days. Consider, as an example, the validation results for "Day 7". This day is indicated by the black vertical dashed line in the image to the left. The validation result for this particular day is marked by a blue circle. Hence, this value is inserted in the time series for "Day 7" for this particular bulletin date, i.e., 2012-08-01 (2012-07-26 + 6 days). |
|
|
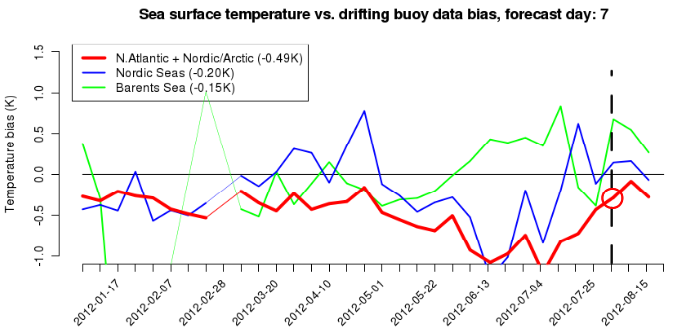
The corresponding selection is made for the same forecast lead times (bulletin + 6 days) from other bulletins, forming the time series displayed below. The image above is for the "Extended domain"/"N. Atlantic + Nordic/Arctic". The corresponding date below is again given by a black dashed line, and the value is marked by a red circle. |
||

|
||