Copernicus Marine Arctic MFC PHY_ICE: Validation of sea ice type
Validation results: Distribution of first year ice, multi-year ice
Products
- Bias, FY ice area extent: area where model has FY ice, and observations don't have FY ice minus area where model doesn't have FY ice, but observations have FY ice
- RMS, FY ice area: RMS of FY ice area fraction differences between model results and observations, multiplied by the analyzed area (here, the fraction is either 1 or 0)
- Bias, MY ice area extent; RMS, MY ice area: Corresponding results for multi-year ice
- Area: Total analyzed area in the observational product, and area with presence of ice in the analysis
All results are displayed in units of 106km2. Furthermore, match-up tables of grid counts of first year ice in model vs. observations are provided separately, follow the link Contingency tables to the upper right to display these tables. Note that results are also produced for three subregions.
Validation data: Ice type
NOTE! The sea ice type observations used here are only available in the period 1 Oct - 15 April (approximately).
Validation of the Copernicus Marine Arctic MFC results for sea ice type is performed using the ice type data from the Copernicus Marine Ocean & Sea Ice TAC. The region for which the observational product is available, is shown in the sample snap-shot below. Shown here are the conditions for 2016-12-01.
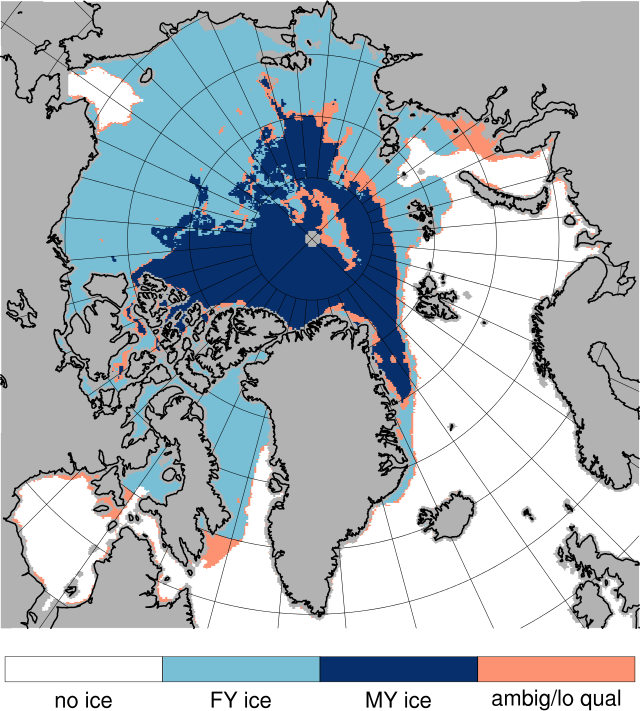
The horizontal resolution of the ice type data is 10 km. This product is based on the grid ratio (GR[19,37]) from SSMIS data, and backscatter data from ASCAT. Each grid has assigned one of four values, corresponding to
- No ice/Very open ice
- Relatively young ice
- Ice that survived a summer melt
- Ambigous results
In the validation, first year ice is assumed to be represented by Relatively young ice.
Ice type data are available from Copernicus Marine product SEAICE_GLO_SEAICE_L4_NRT_OBSERVATIONS_011_001.
Important note on quality
In general, one should be aware that observational data are not identical to truth. First, instrument inaccuracies (or even errors) contribute. Next, frequently the observations are indirect measures of the quantity that is reported (e.g. measured radiation from a body from which its temperature is derived), adding to the uncertainty that is due to instrument inaccuracies. In the present case, an advanced algorithm is applied to derive a gridded product for regions that are infested with first year ice, and those that are infested with multi-year ice. While the advanced algorithms that applied are state-of-the-art for the present purpose, the accuracy of the ice type product may reflect the number of steps needed to be impemented in the present production.
ARC-MFC PHY_ICE (neXtSIM)
The model results are produced with the neXtSIM stand-alone sea ice model running the Brittle-Bingham-Maxwell sea ice rheology on an adaptive triangular mesh of 10 km average cell length. neXtSIM is forced with surface atmosphere forcings from ECMWF and ocean forcings from the ARC-MFC PHYS NRT system. neXtSIM runs daily, assimilating OSI-SAF sea ice concentrations (SSMI and AMSR2) from the SI TAC and provides 7-day forecasts. The adaptive Lagrangian mesh is interpolated for convenience onto a 3 km resolution regular grid in a Polar Stereographic projection.