Layer 1-ARGO | Layer 1-ITP
Layer 2-ARGO | Layer 2-ITP
Layer 3-ARGO | Layer 3-ITP
Layer 4-ARGO
Layer 5-ARGO
Time series of validation results for T, S profiles; mixed layer
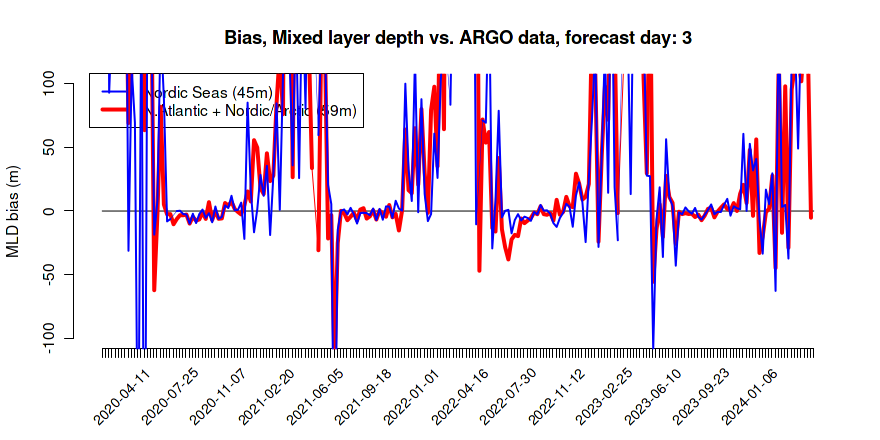
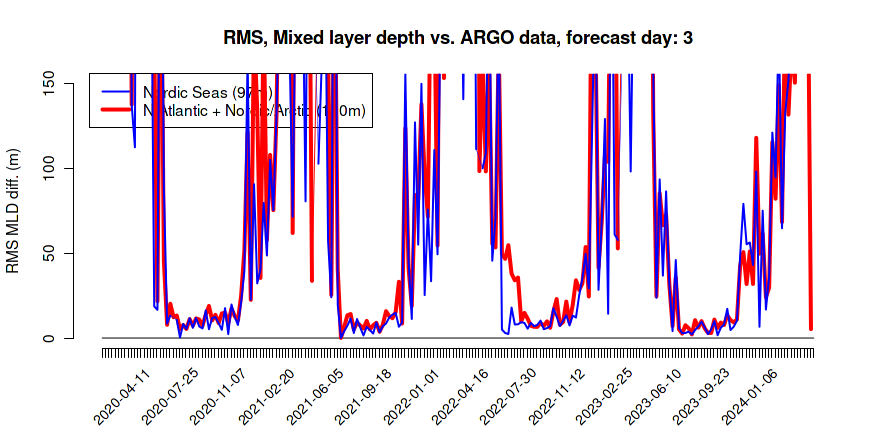
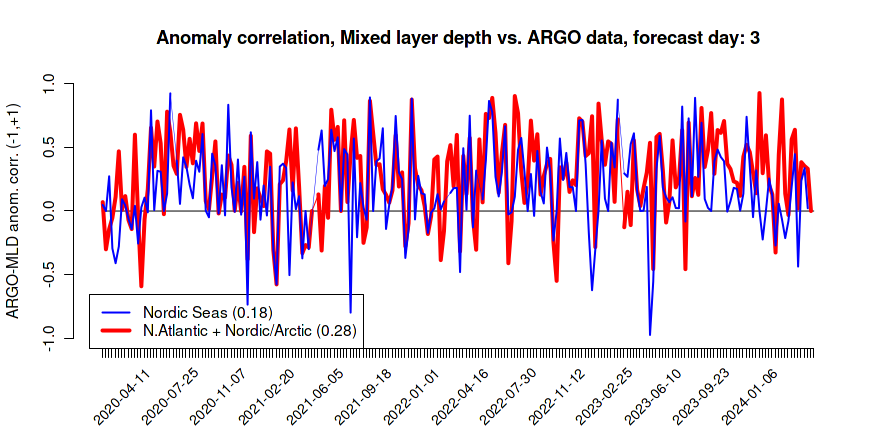
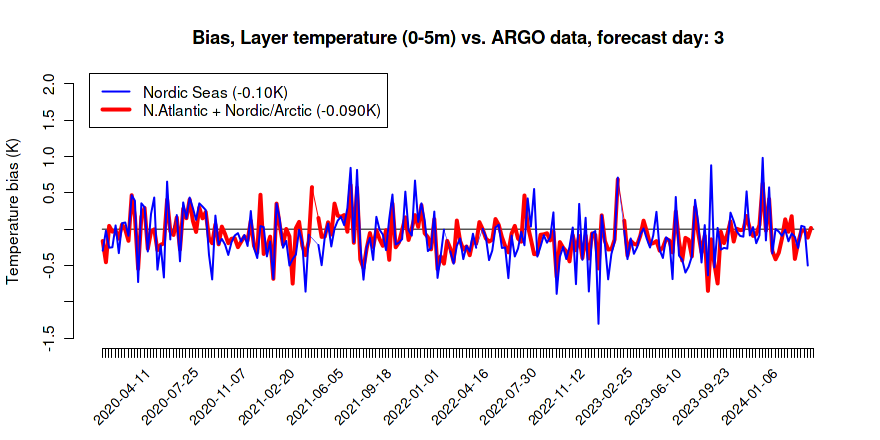
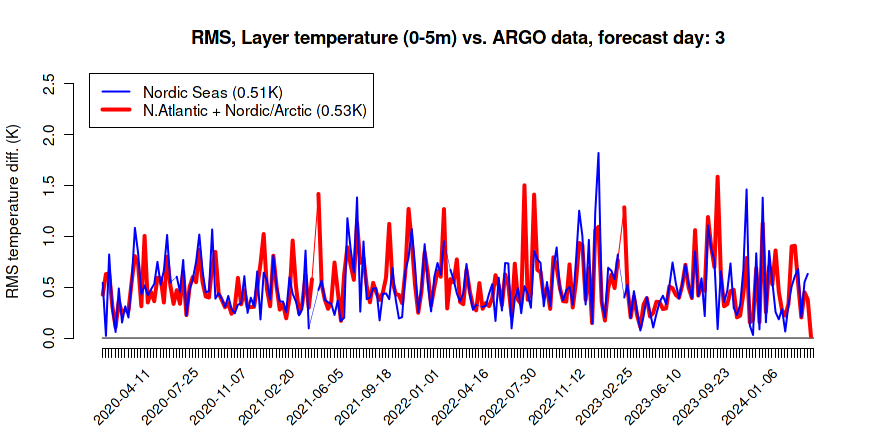
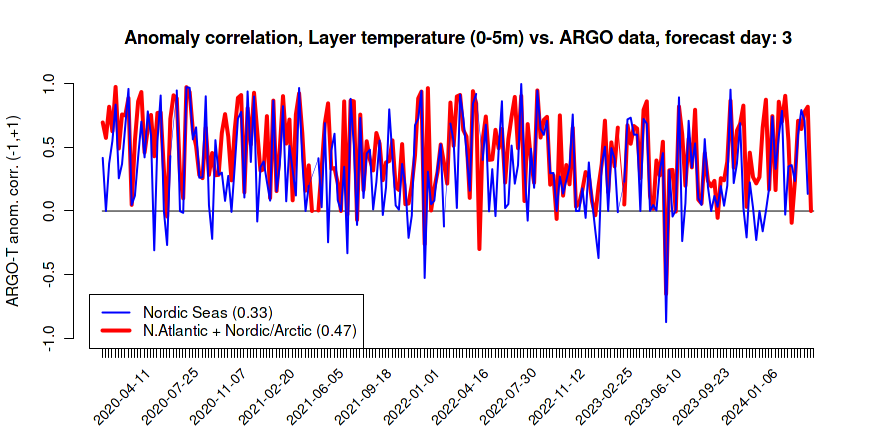
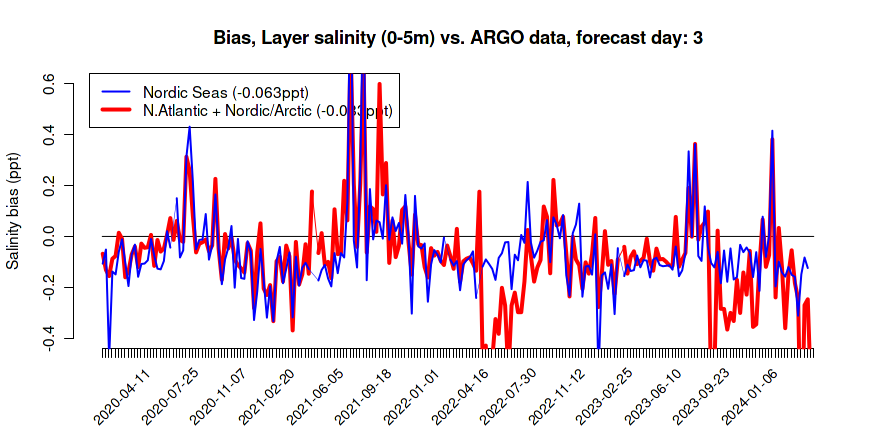
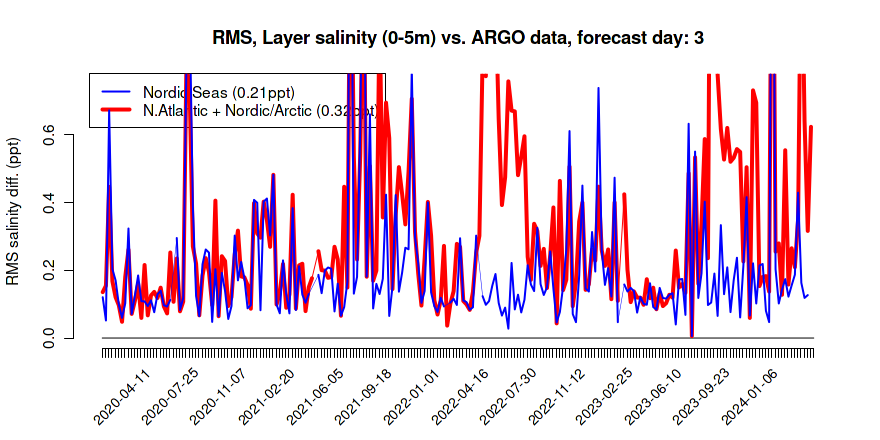
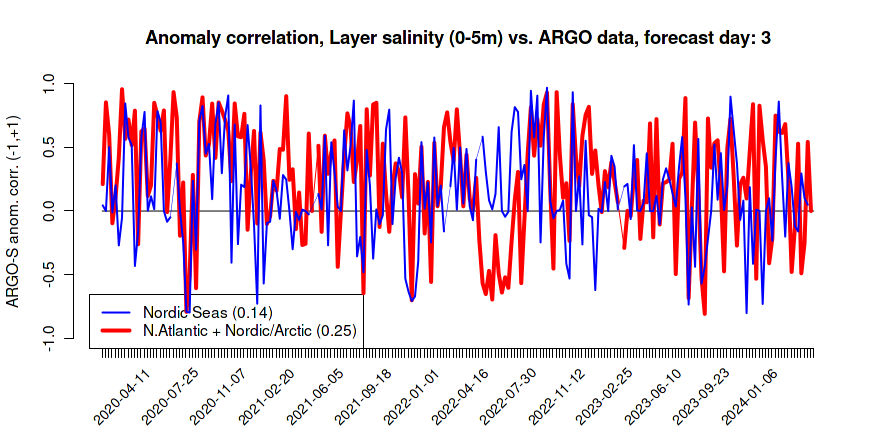
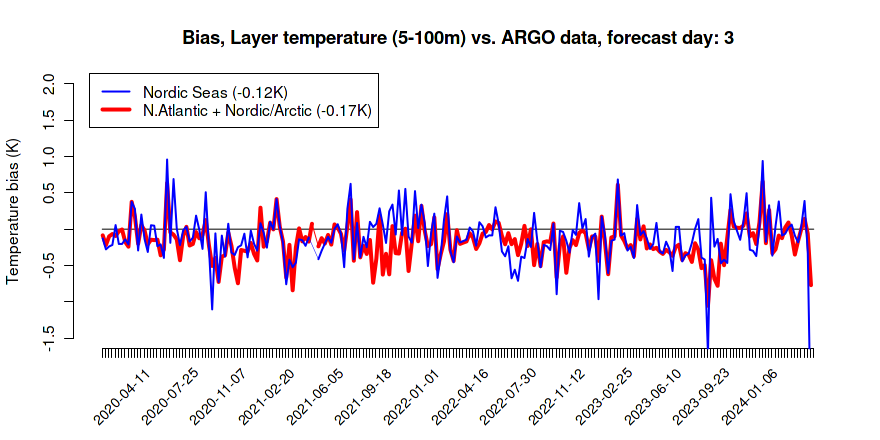
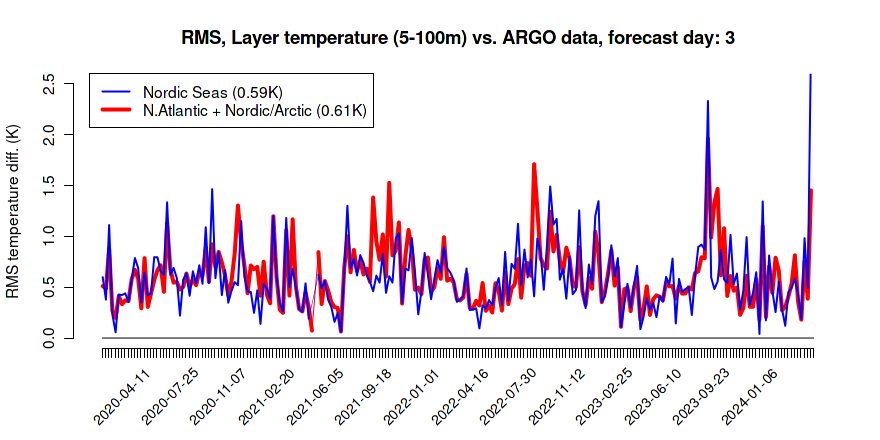
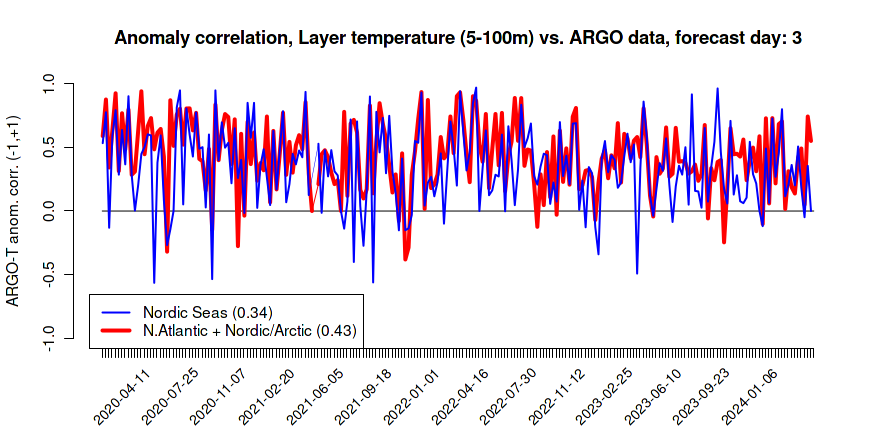
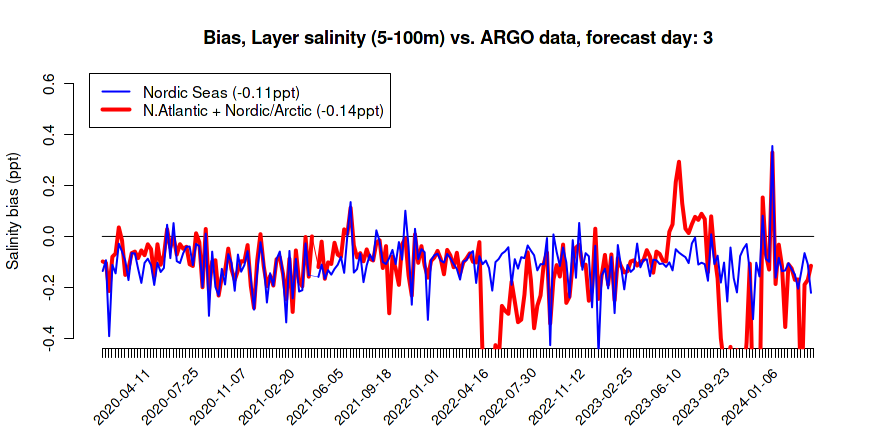
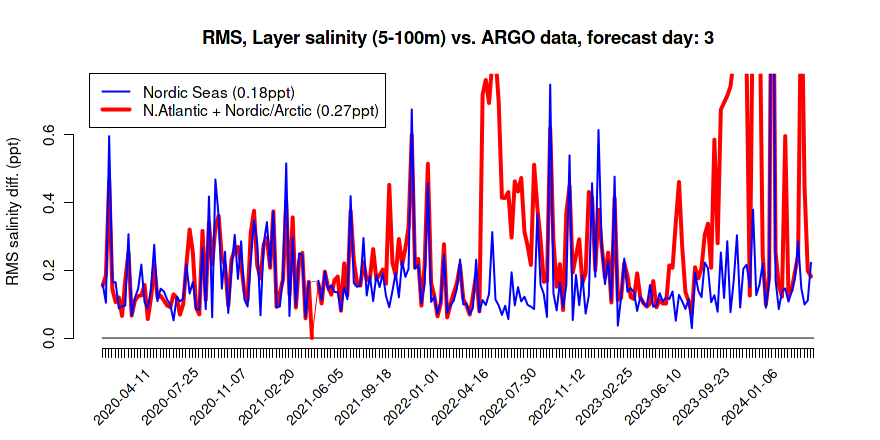
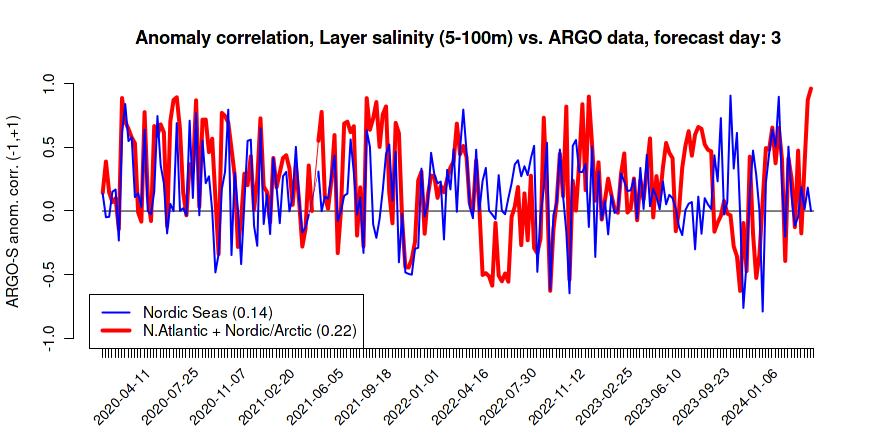
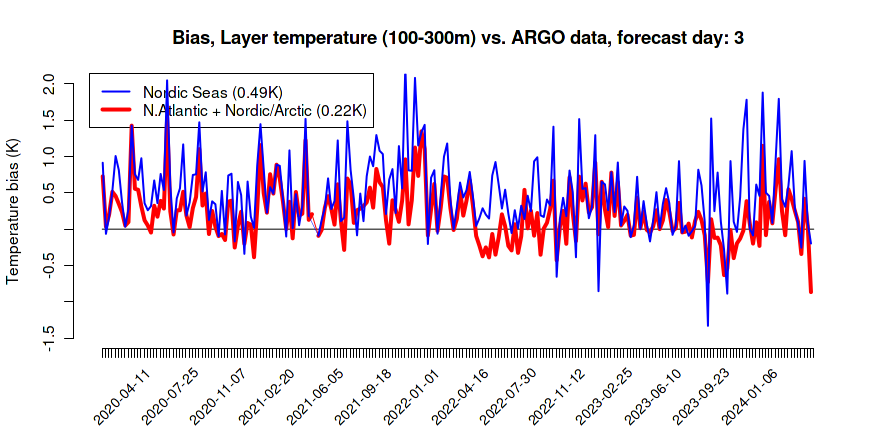
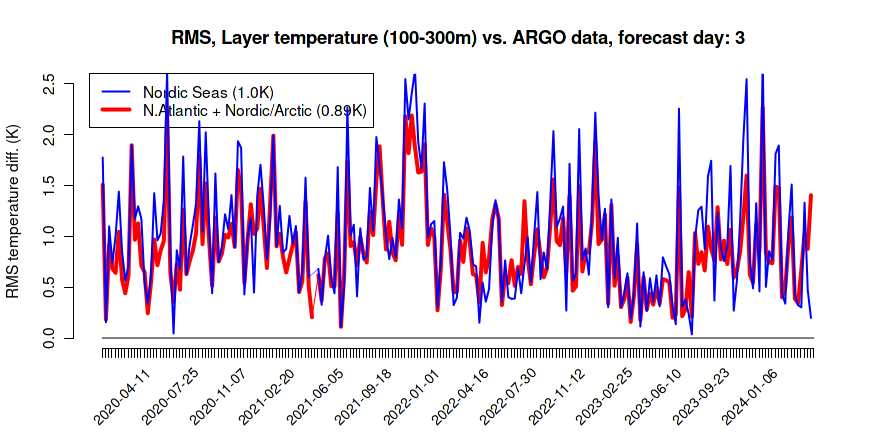
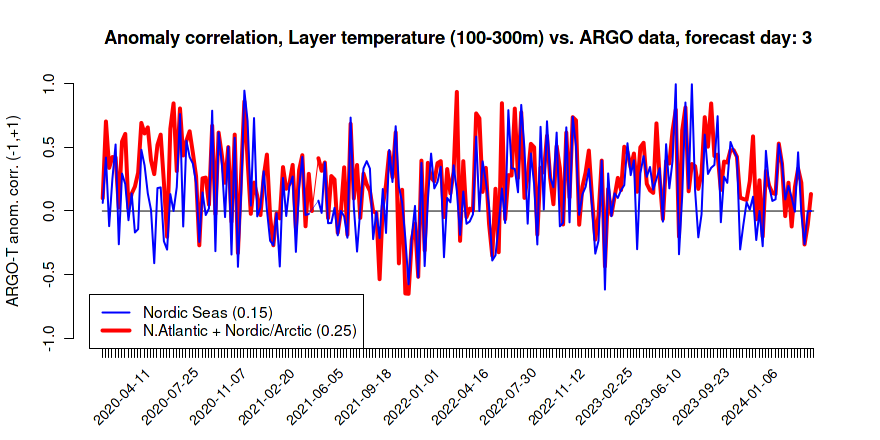
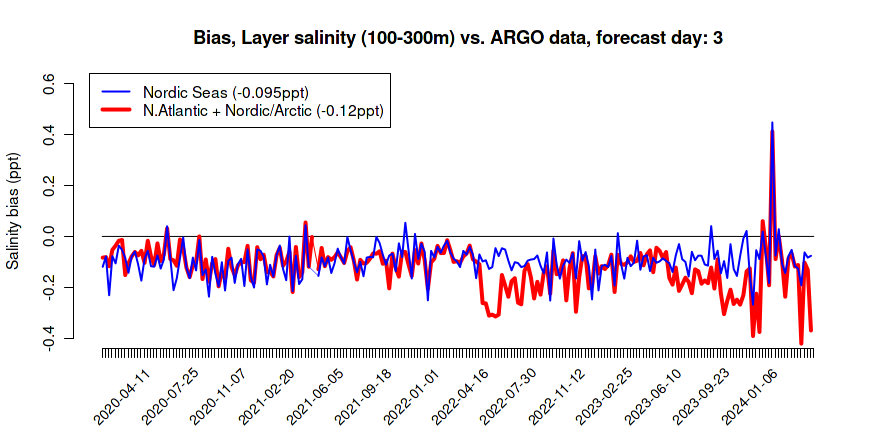
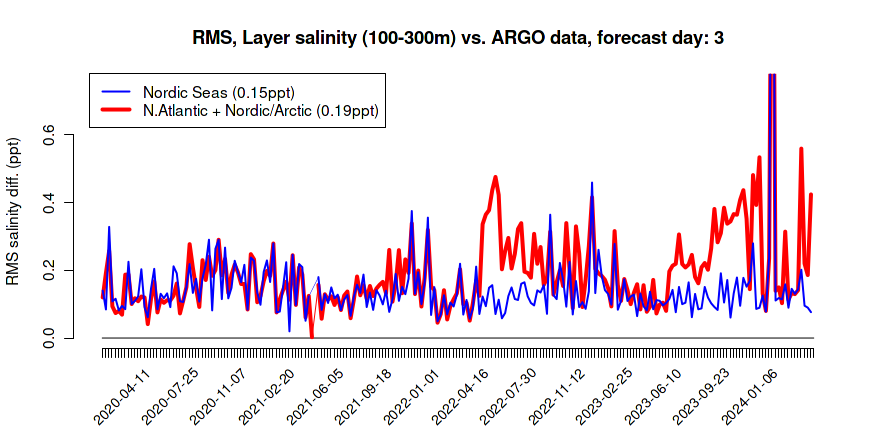
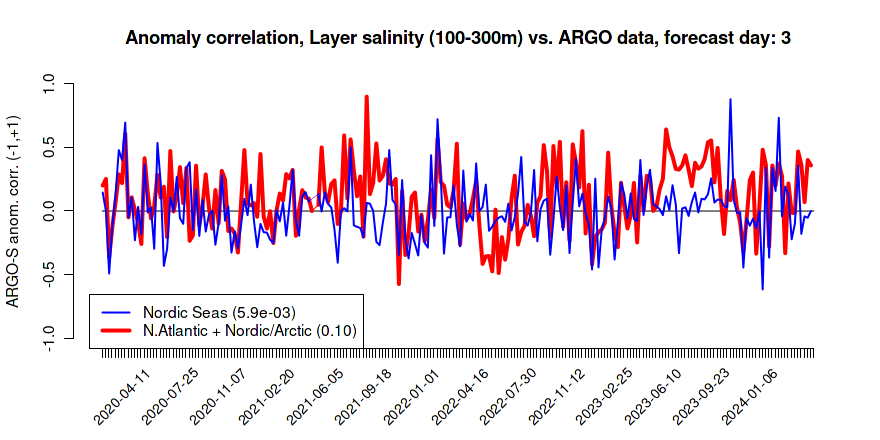
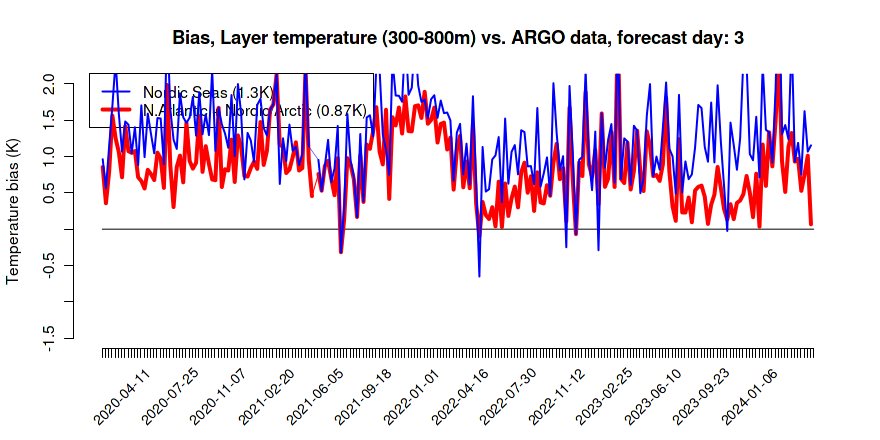
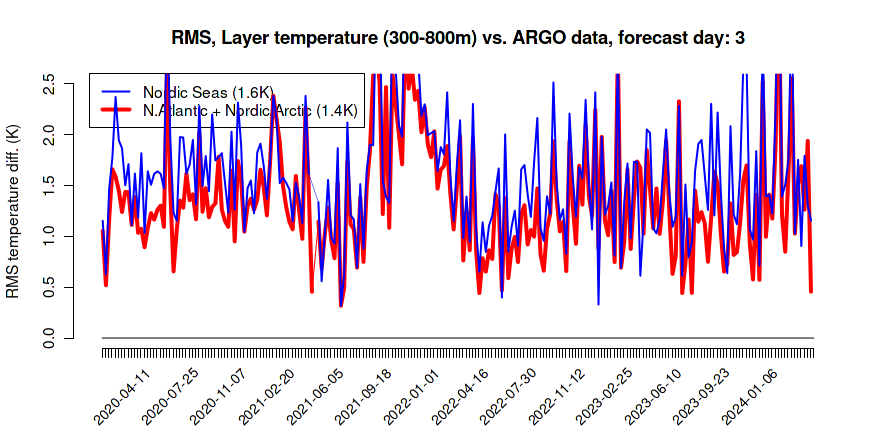
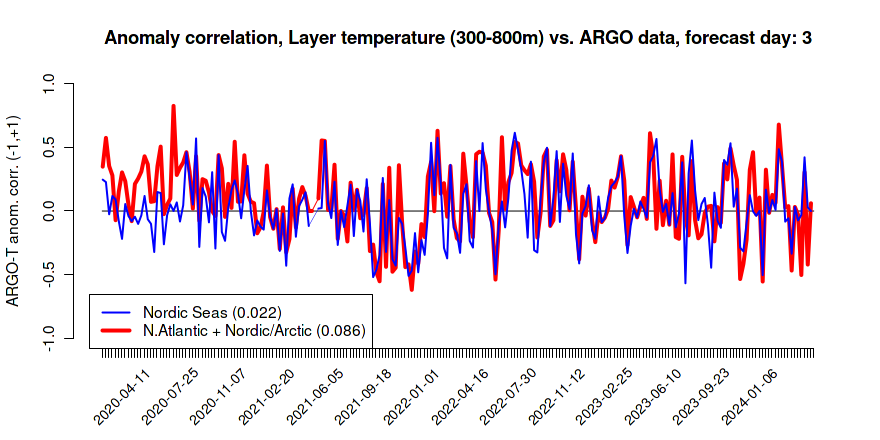
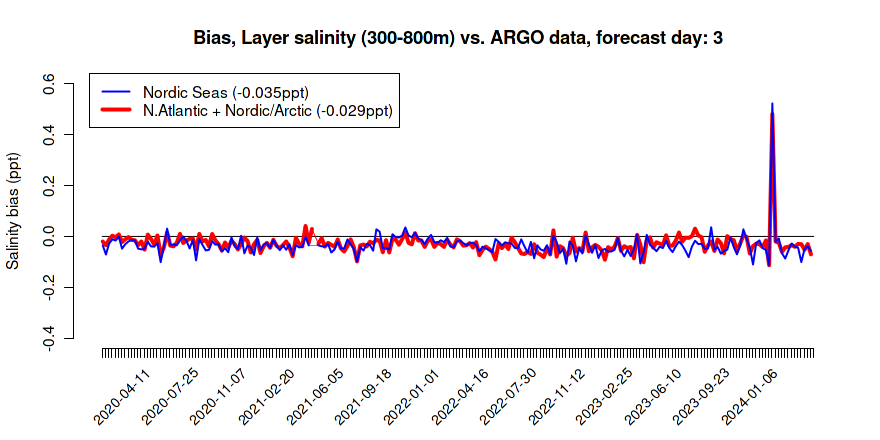
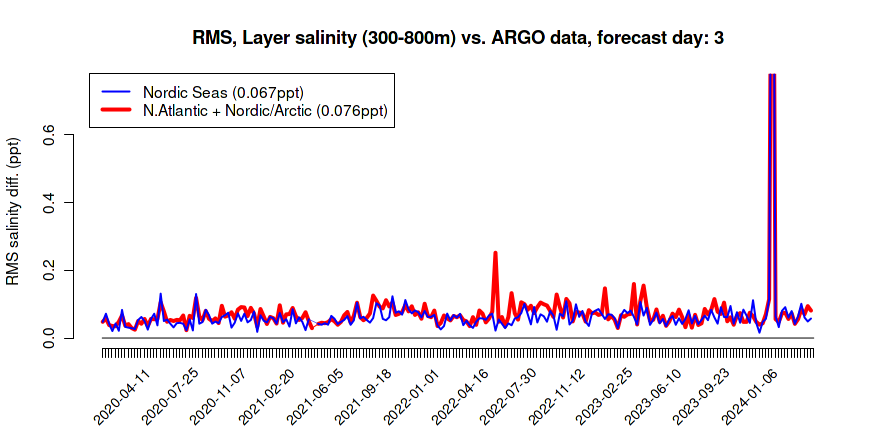
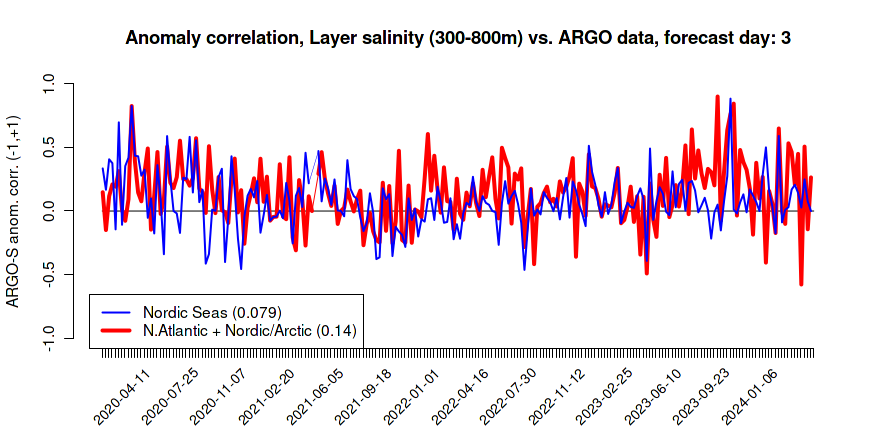
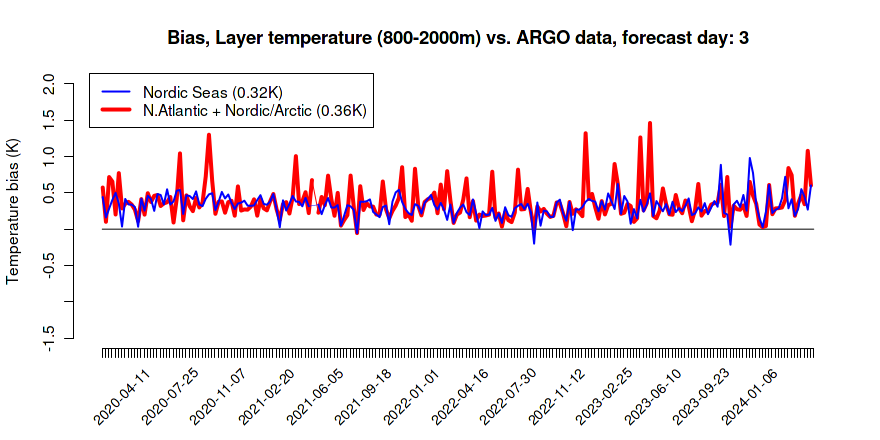
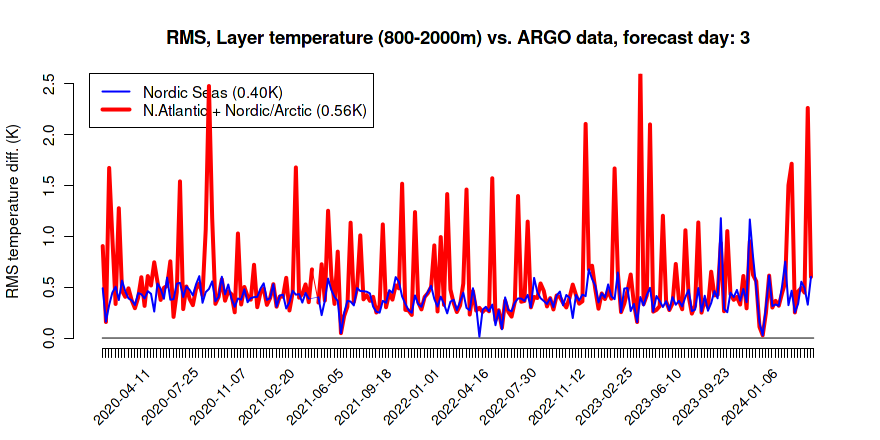
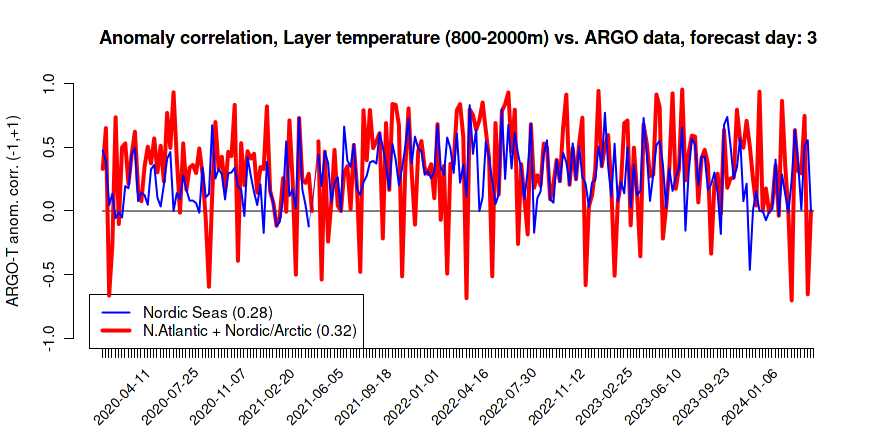
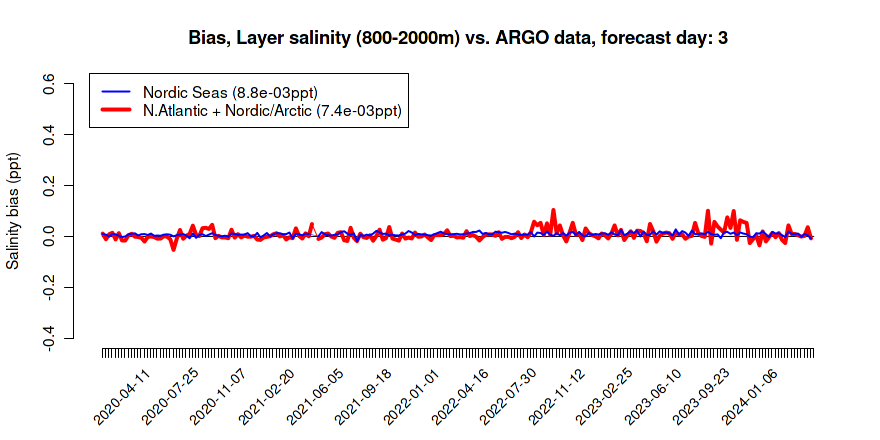
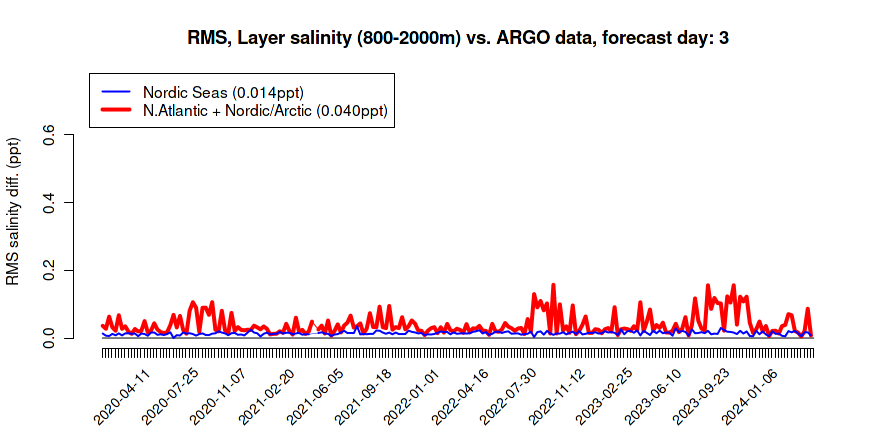
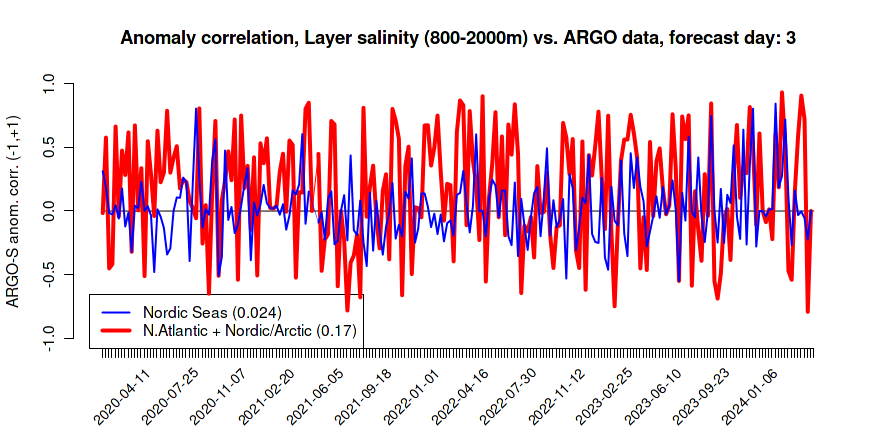
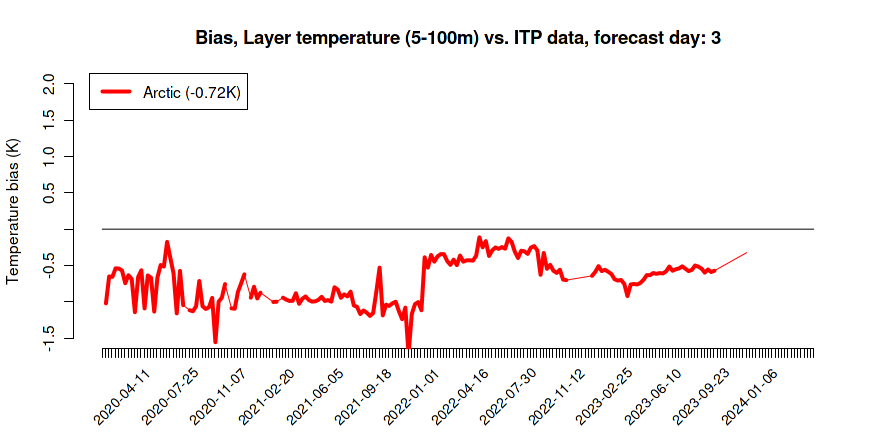
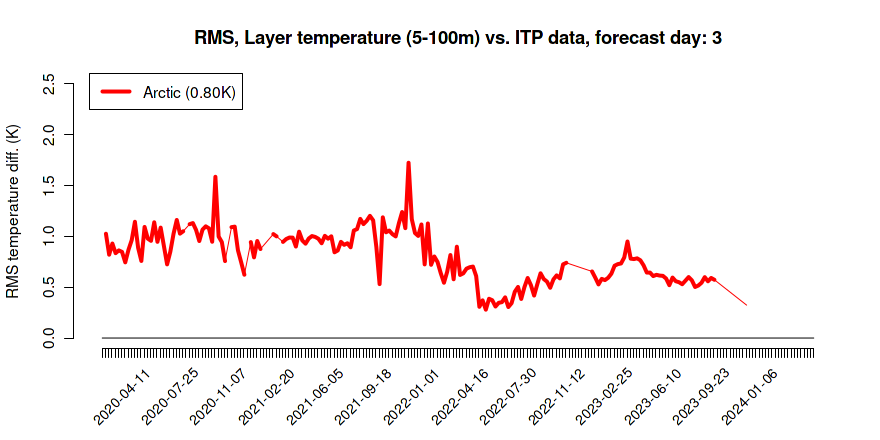
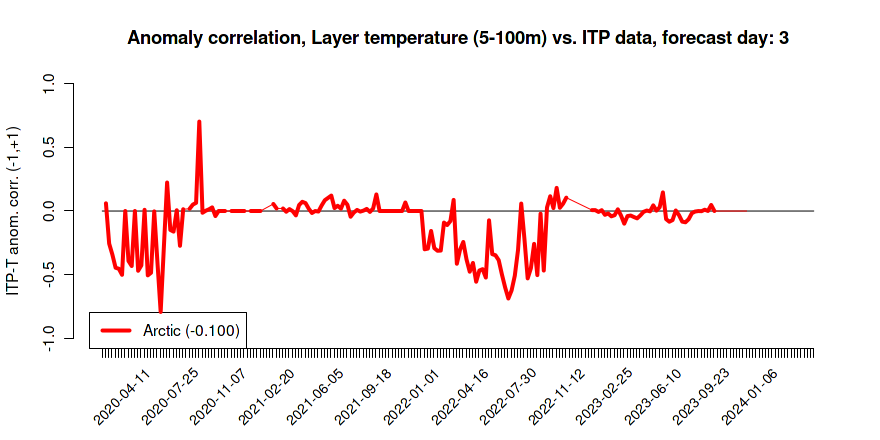
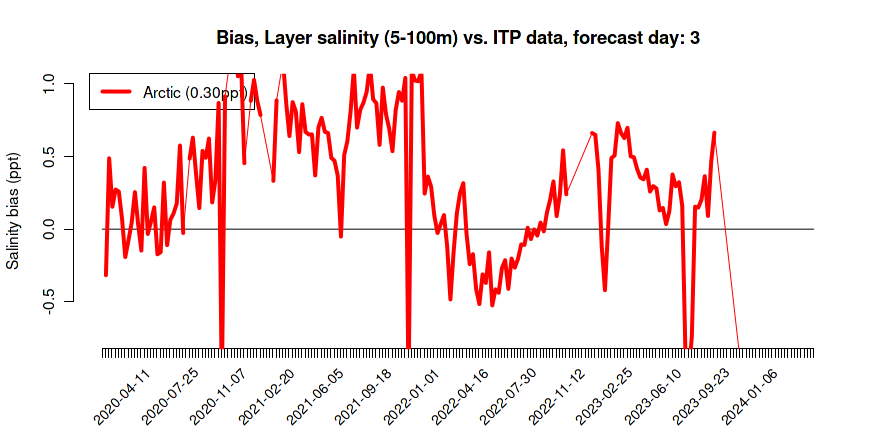
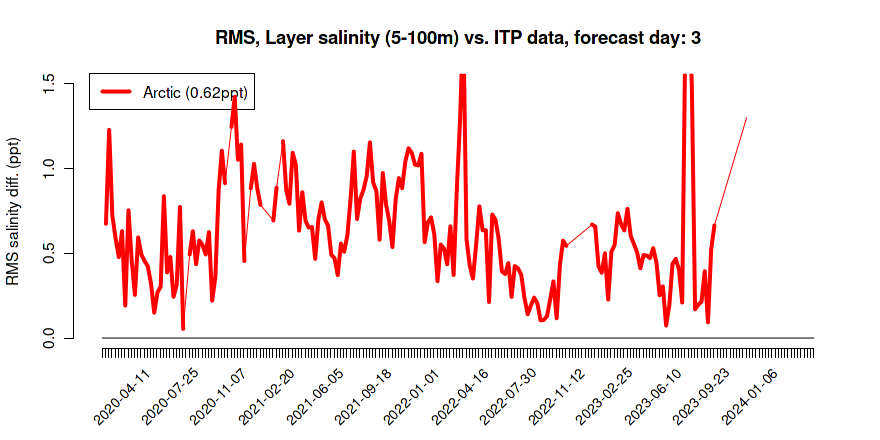
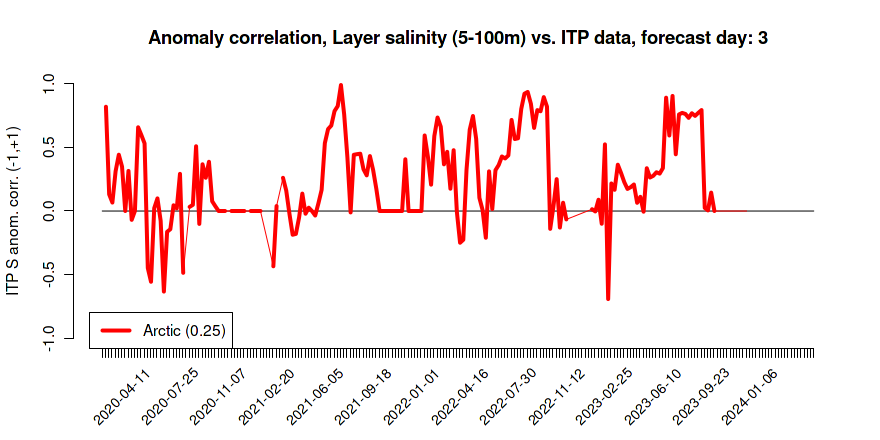
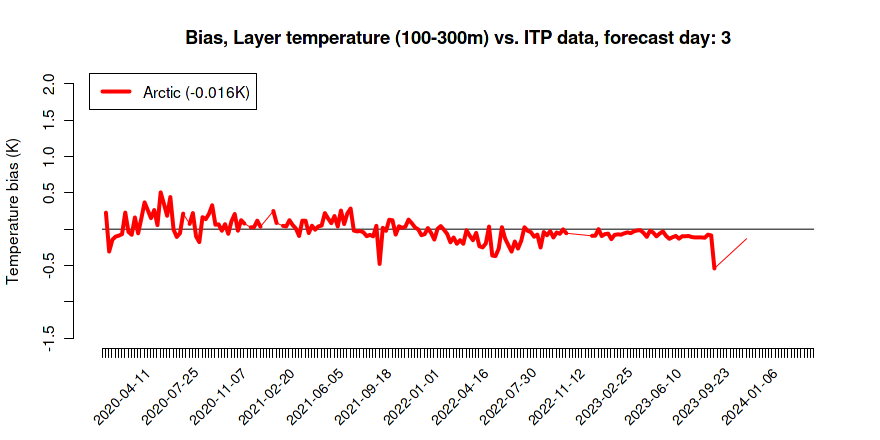
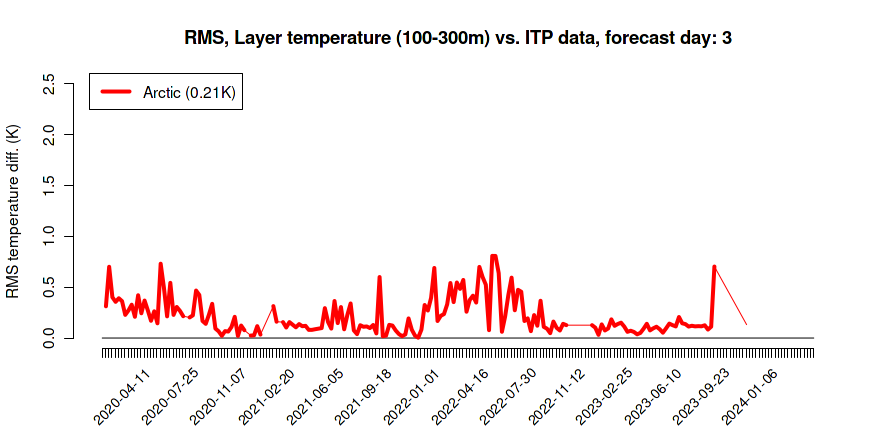
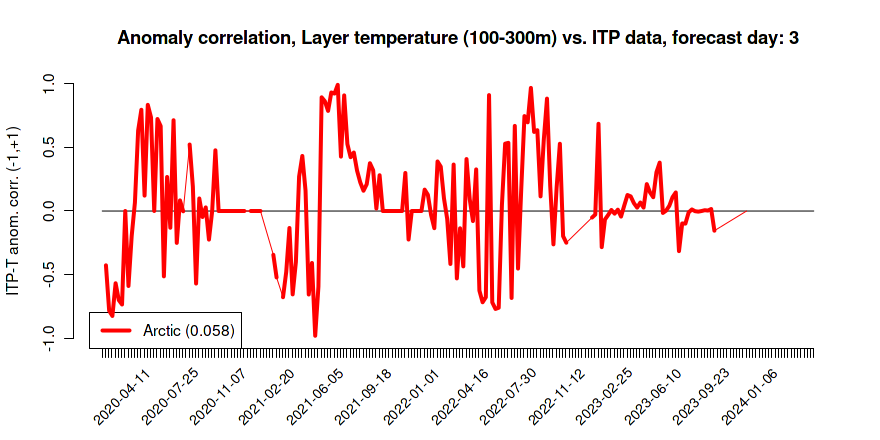
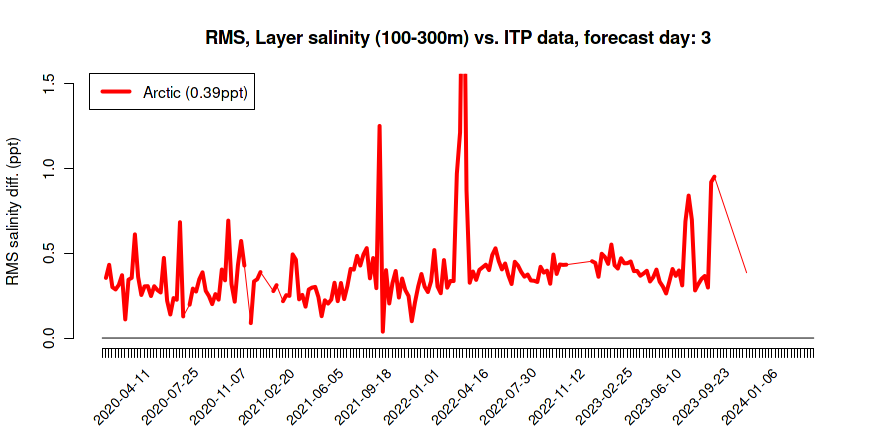
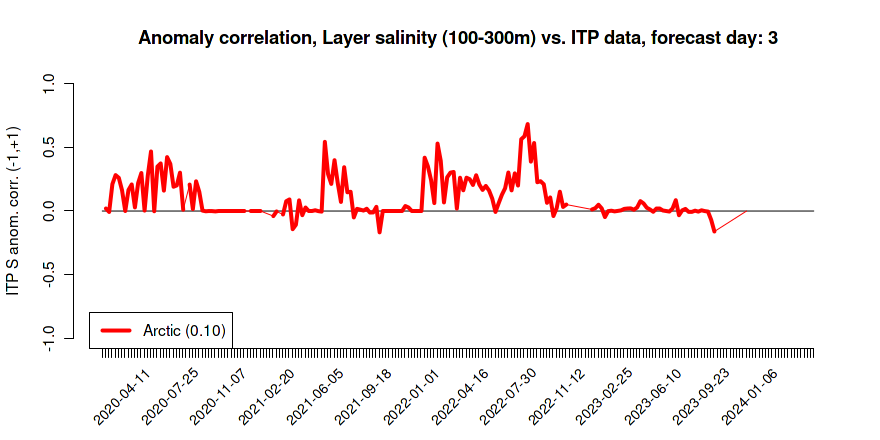
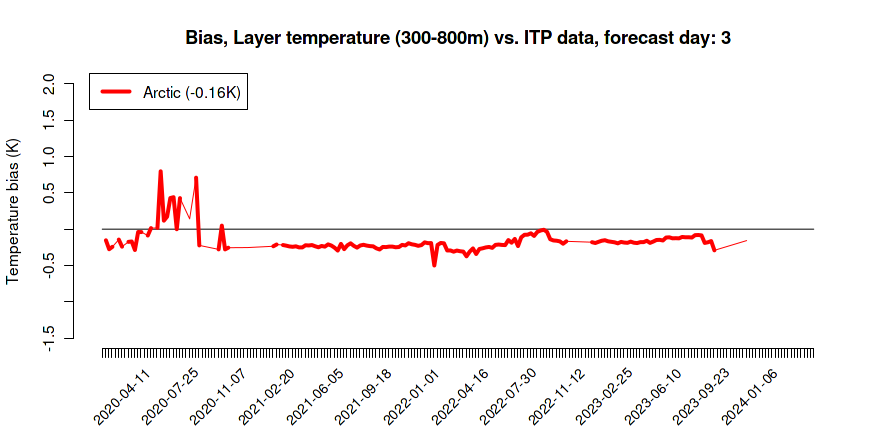
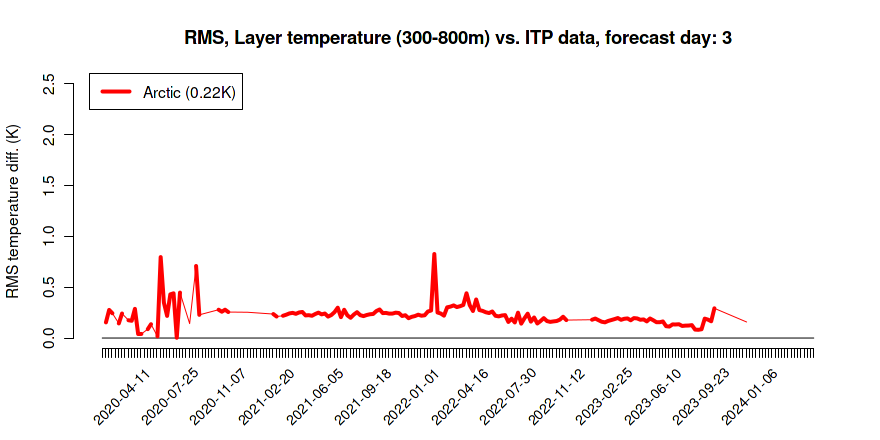
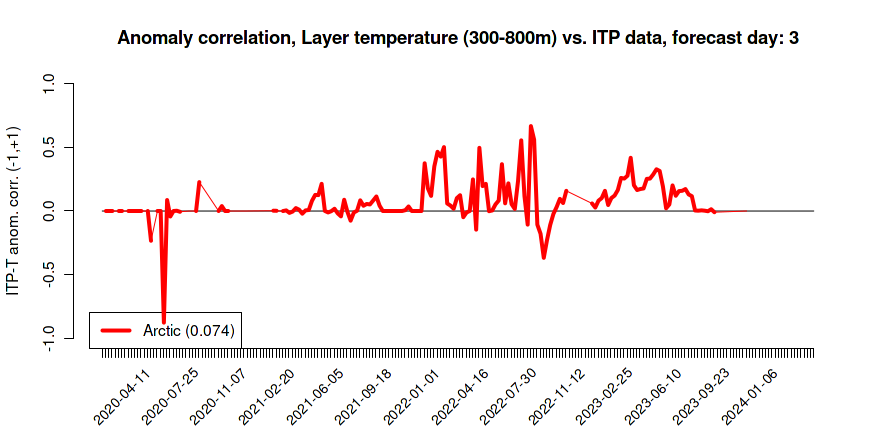
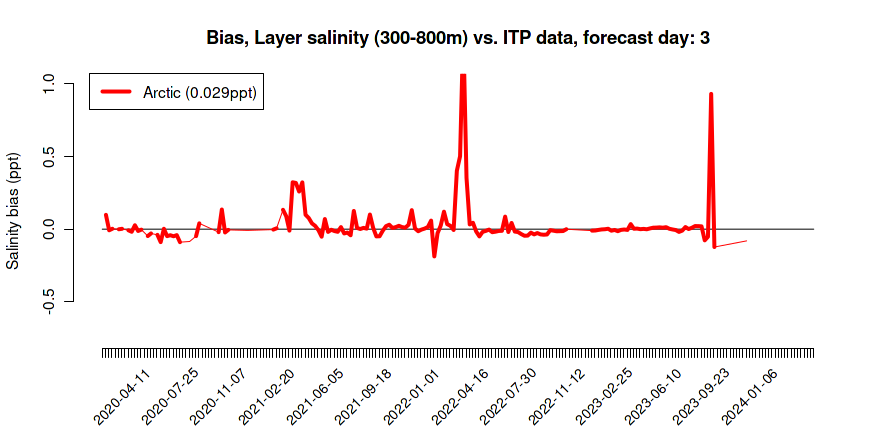
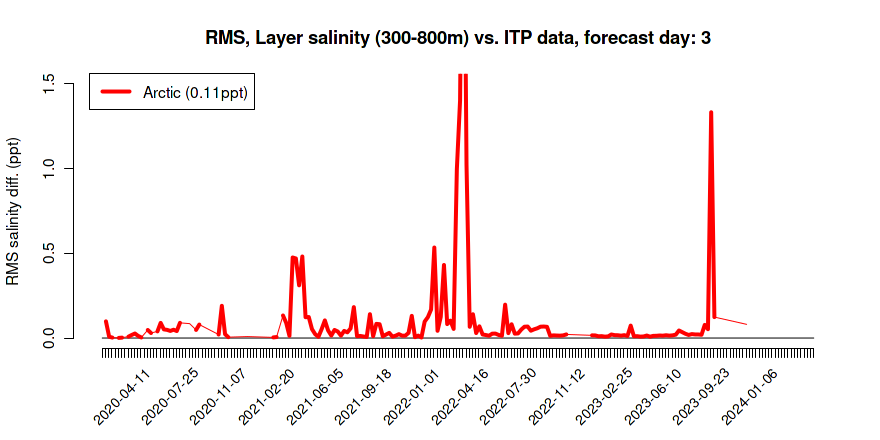
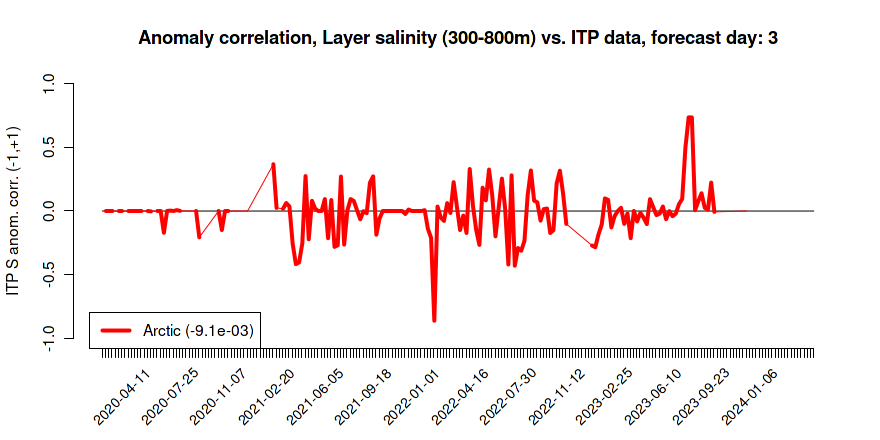
Results below are for the daily average for the 2nd day after the day when the bulletin was issued. The bulletin date is given as the x-axis coordinate in the images below. Average values for the time series that are displayed, are given in parenthesis in the line label legend.
T, S profile; mixed layer vs. ARGO data (profiling buoys)
Information on validation data, methods, regions, and model results
Mixed layer depth
Temperature, layer no. 1 (0-5 m)
Salinity, layer no. 1
Temperature, layer no. 2 (5-100 m)
Salinity, layer no. 2
Temperature, layer no. 3 (100-300 m)
Salinity, layer no. 3
Temperature, layer no. 4 (300-800 m)
Salinity, layer no. 4
Temperature, layer no. 5 (800-2000 m)
Salinity, layer no. 5
T, S profile vs. ITP data (profiling buoys)
Information on validation data, methods, regions, and model results
Temperature, layer no. 1 (5-100 m)
Salinity, layer no. 1
Temperature, layer no. 2 (100-300 m)
Salinity, layer no. 2

Temperature, layer no. 3 (300-800 m)
Salinity, layer no. 3
Generated by /metno/routine/sms/V2/timeSeries/validationTimeSeries.sh Fri 29 Mar 2024 06:14:07 AM UTC on arcval