T,S vs. ARGO
T.S vs. ITP
Layer 1-ARGO | Layer 1-ITP
Layer 2-ARGO | Layer 2-ITP
Layer 3-ARGO | Layer 3-ITP
Layer 4-ARGO
Layer 5-ARGO
Time series of validation results for the ocean surface
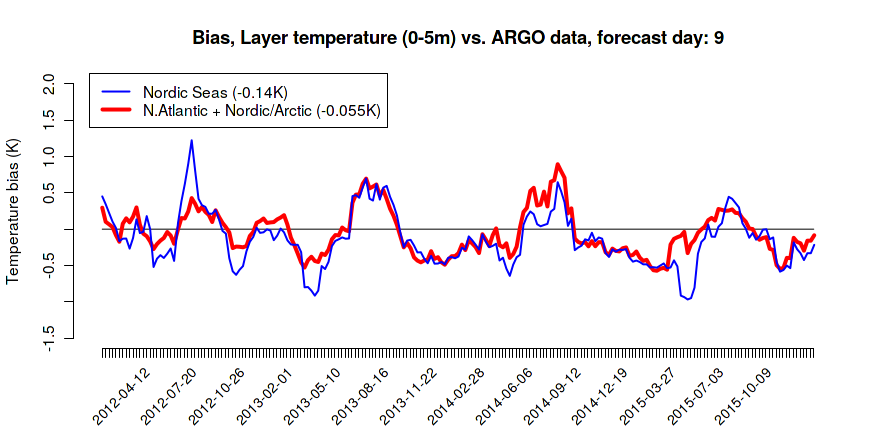
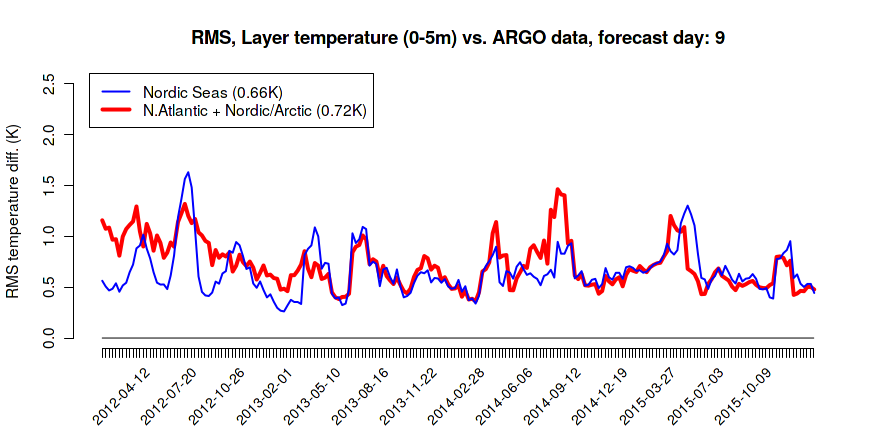
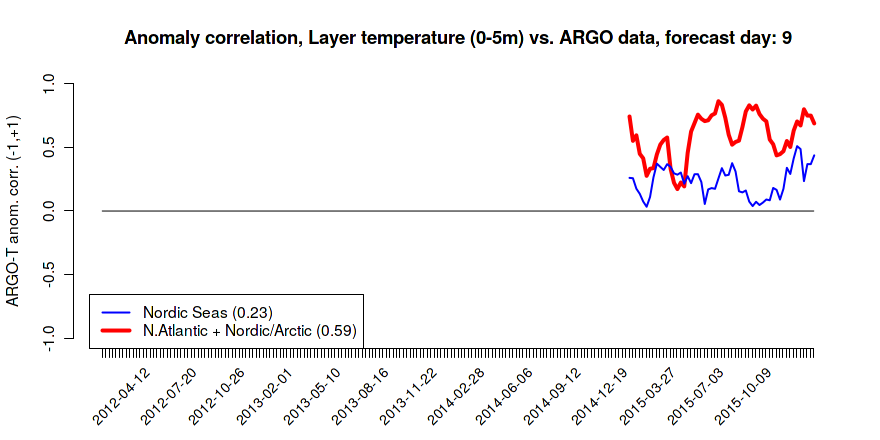
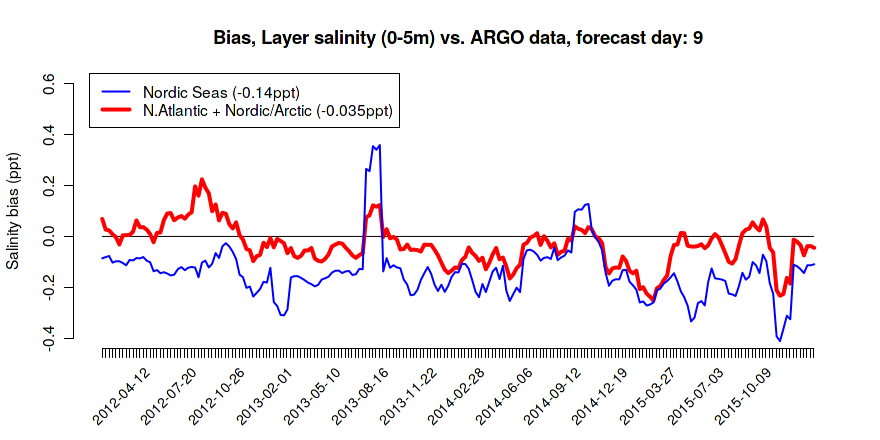
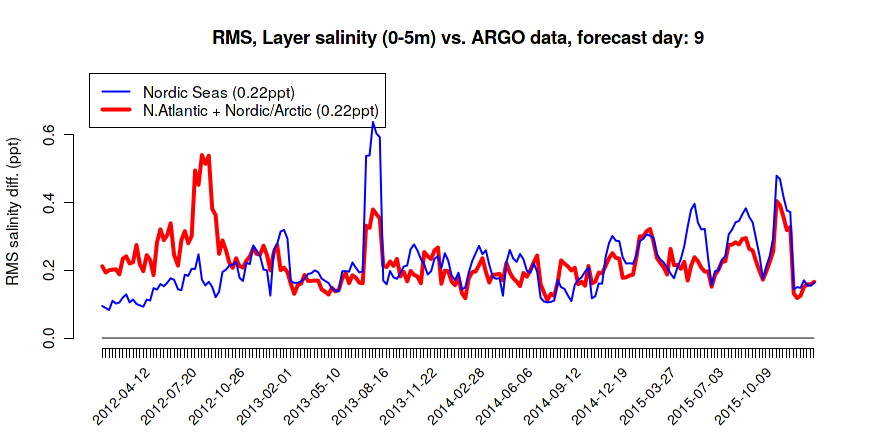
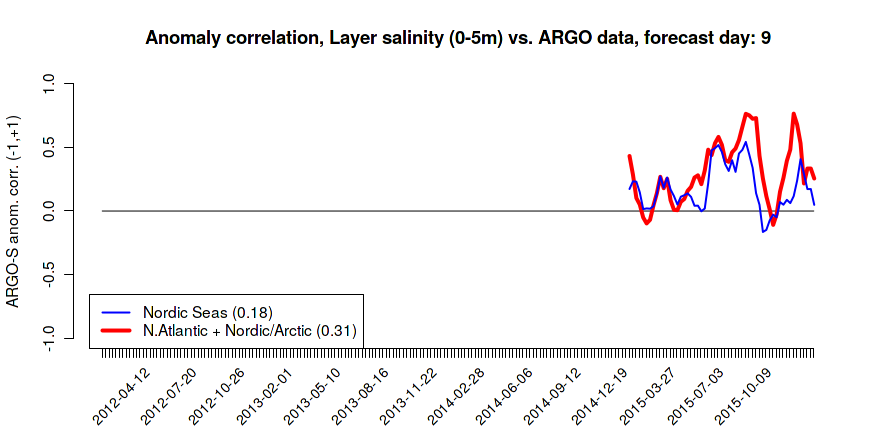
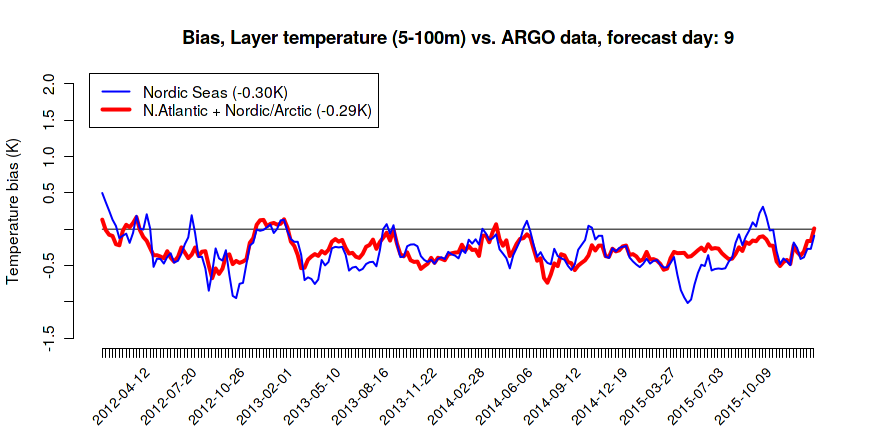
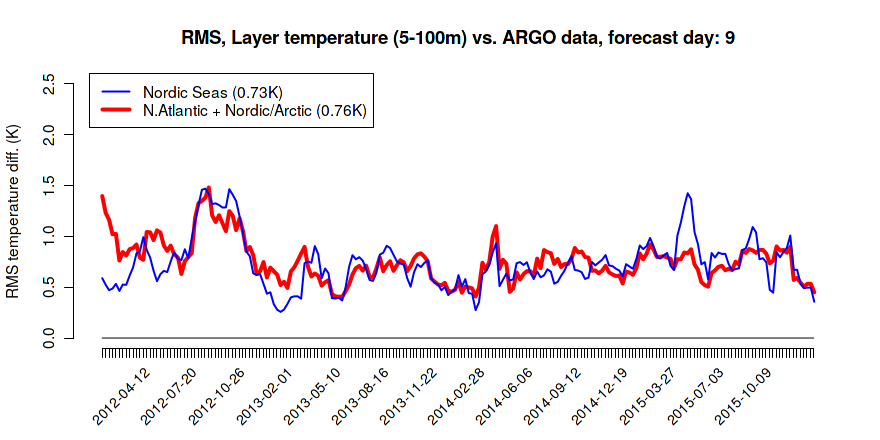
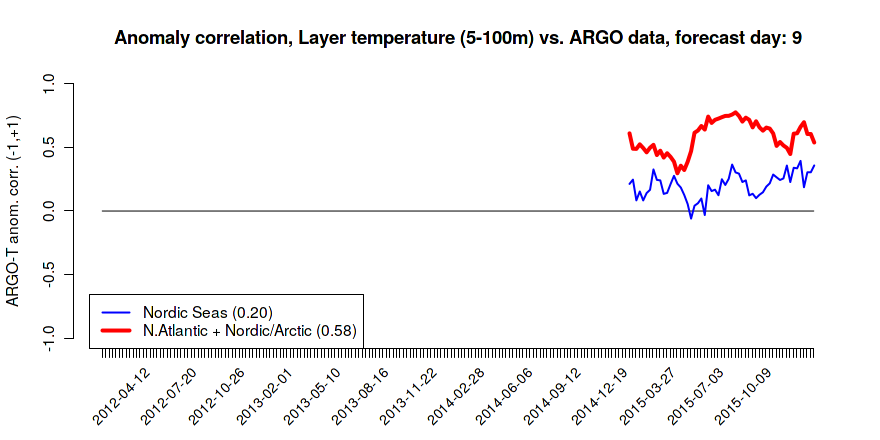
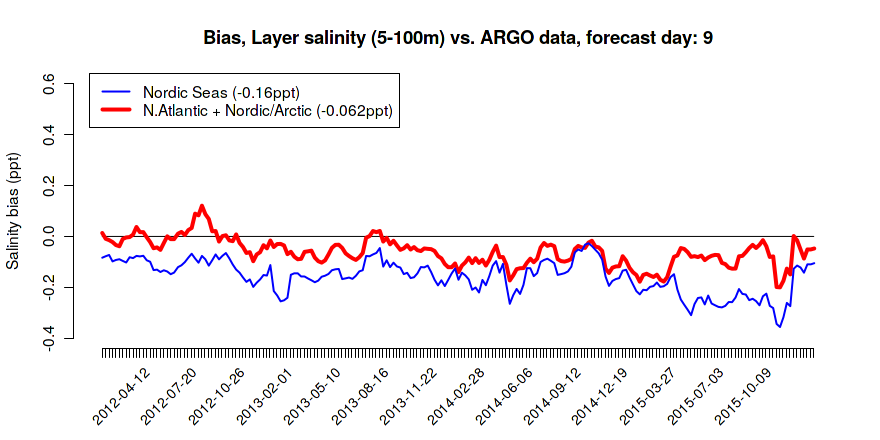
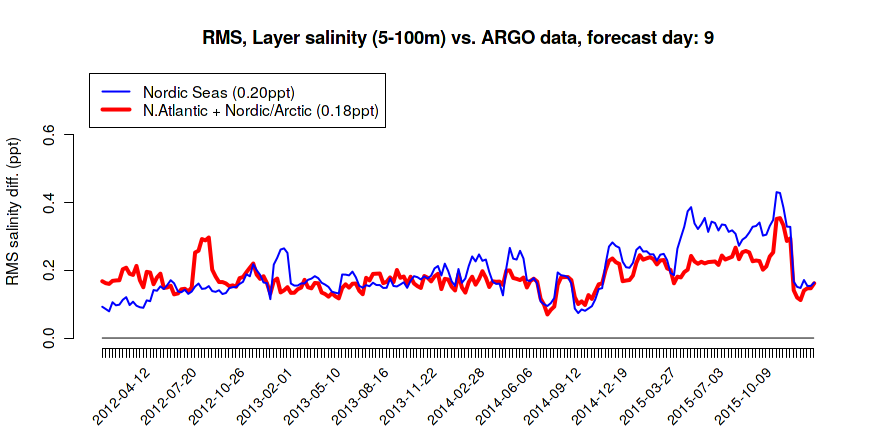
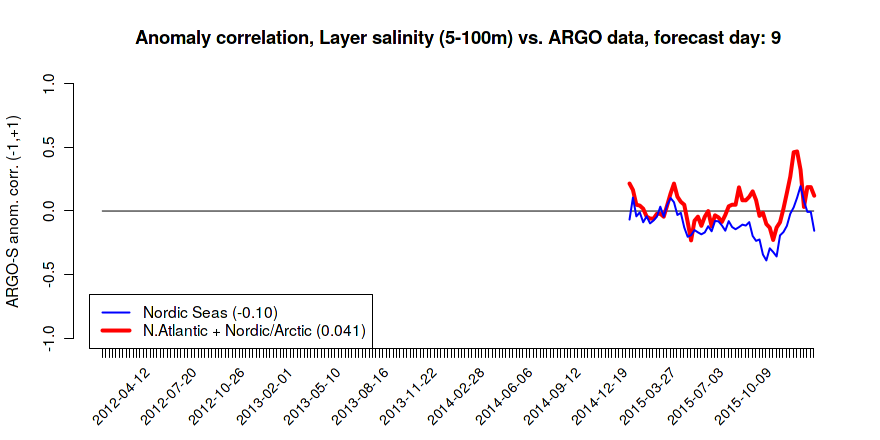
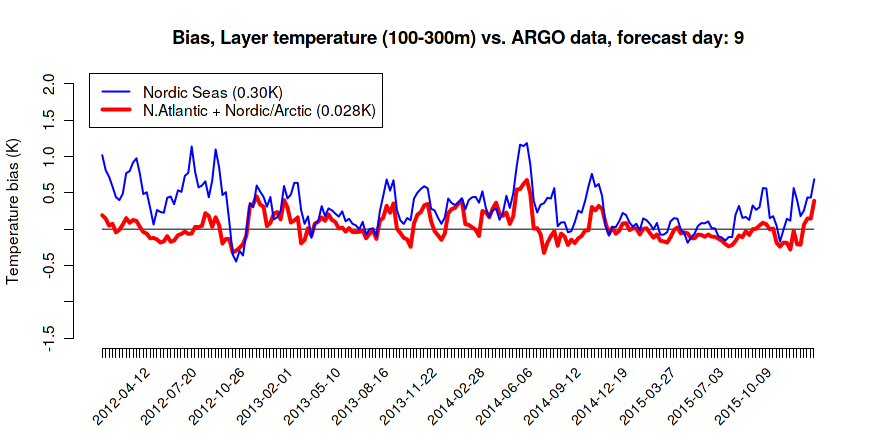
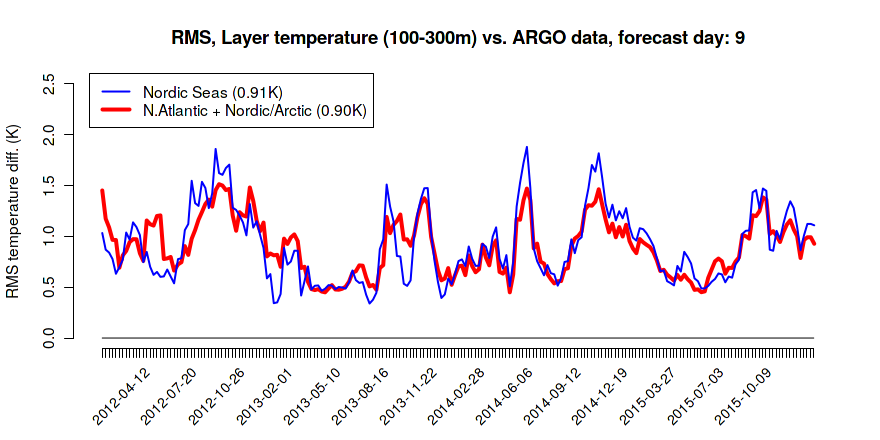
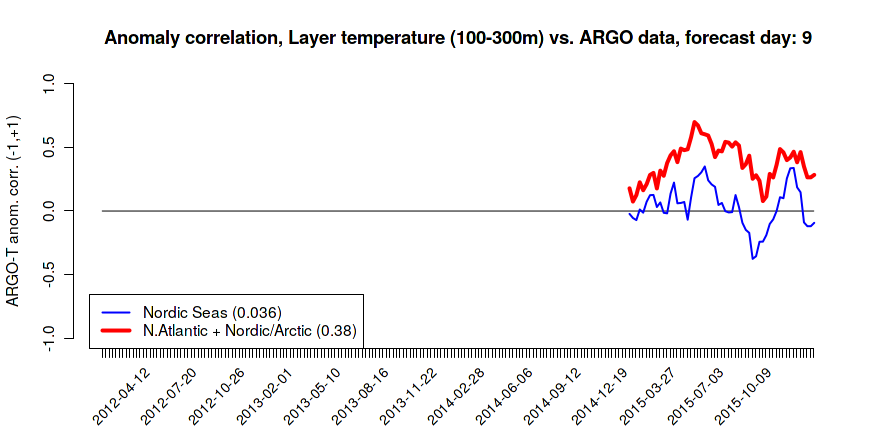
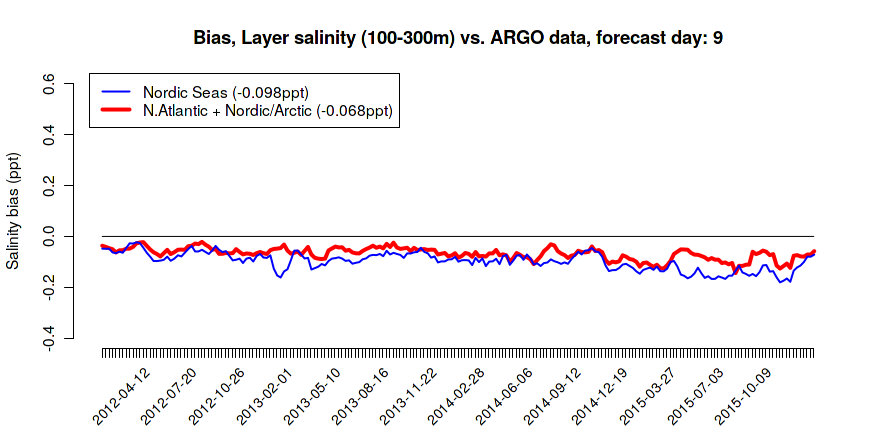
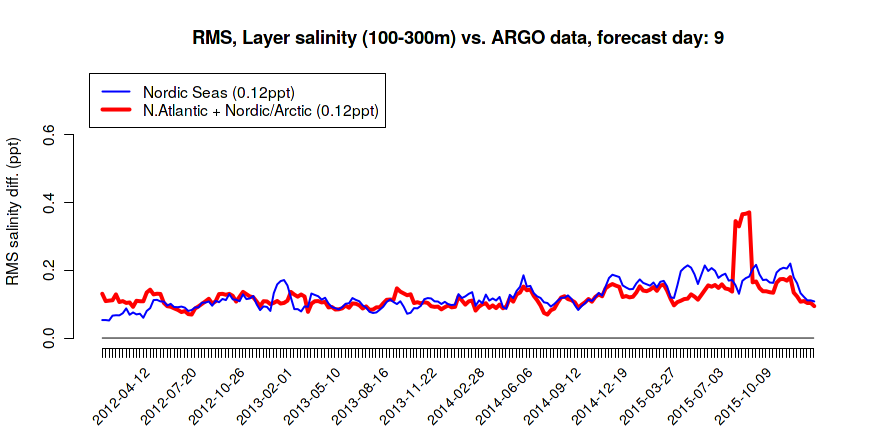
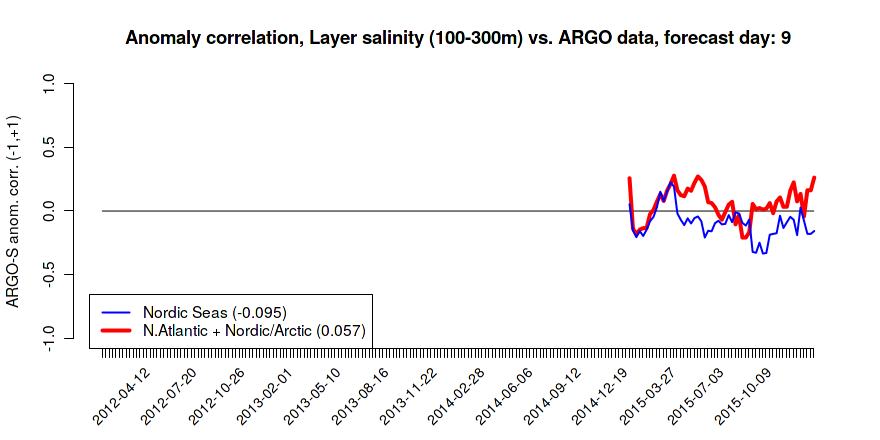
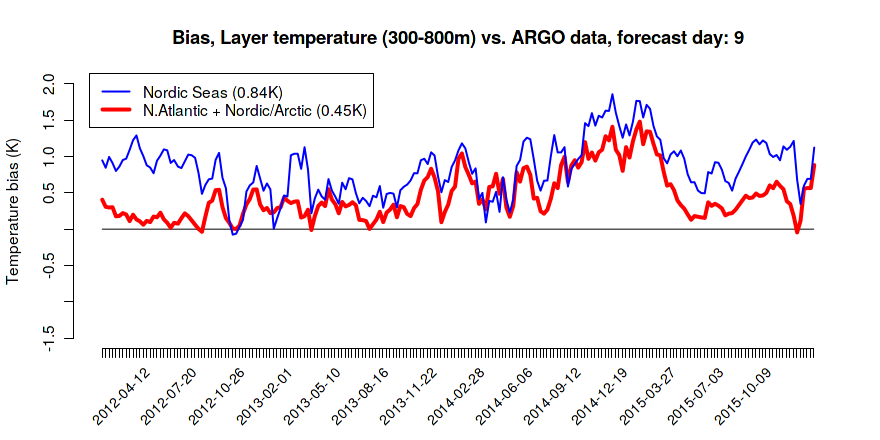
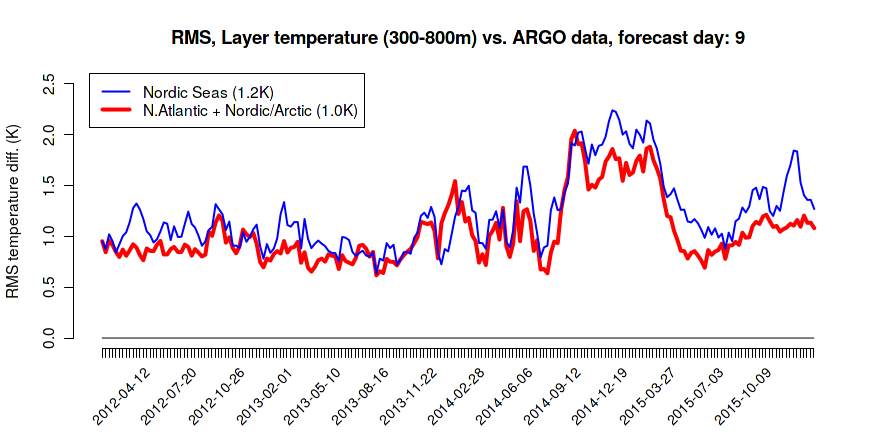
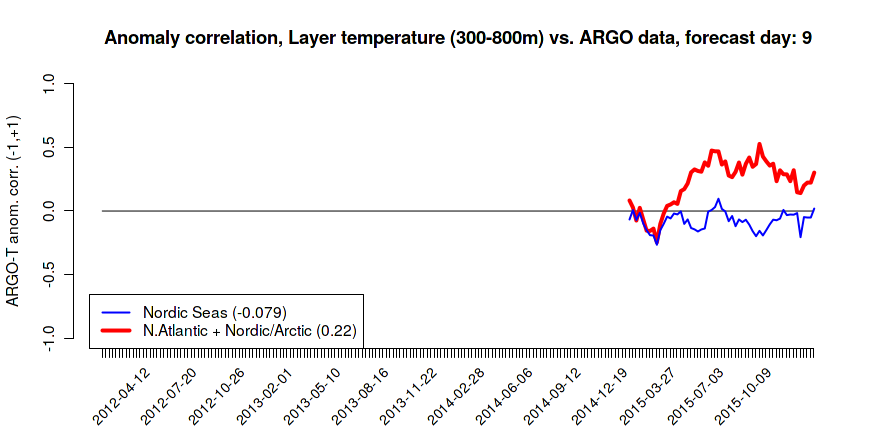
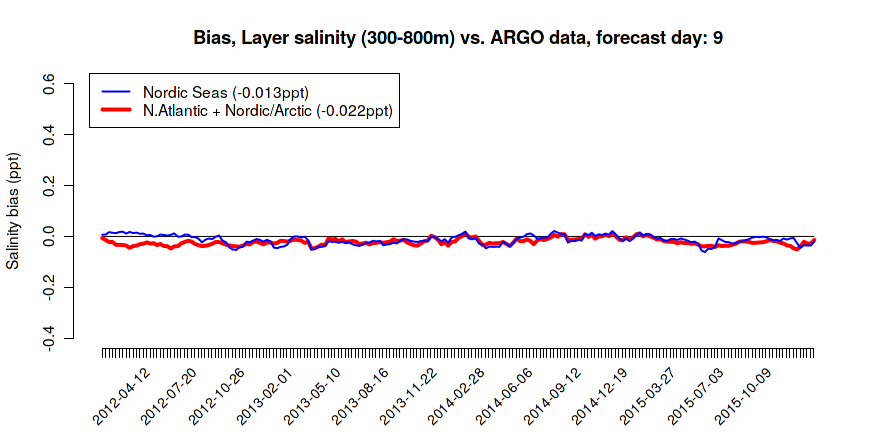
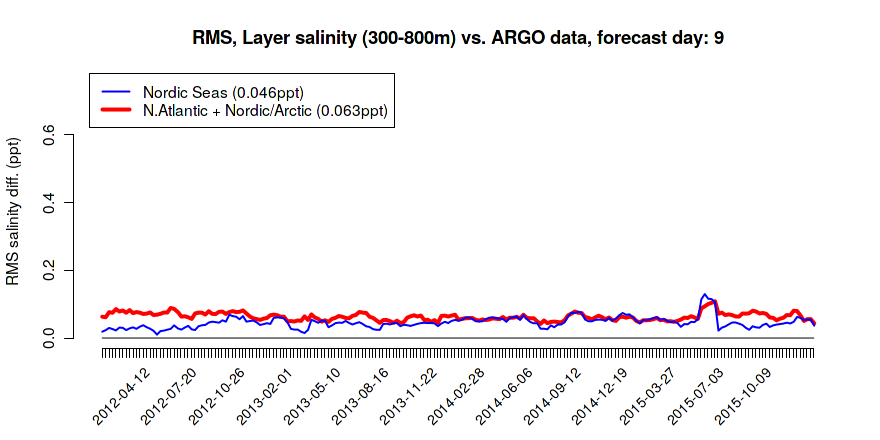
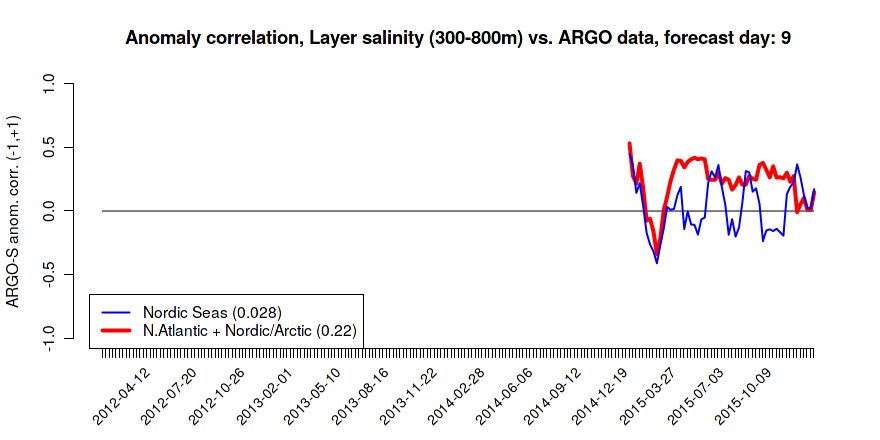
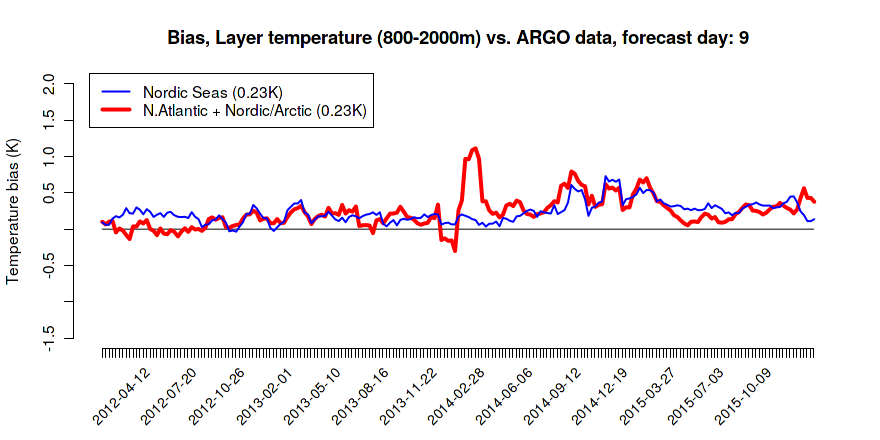
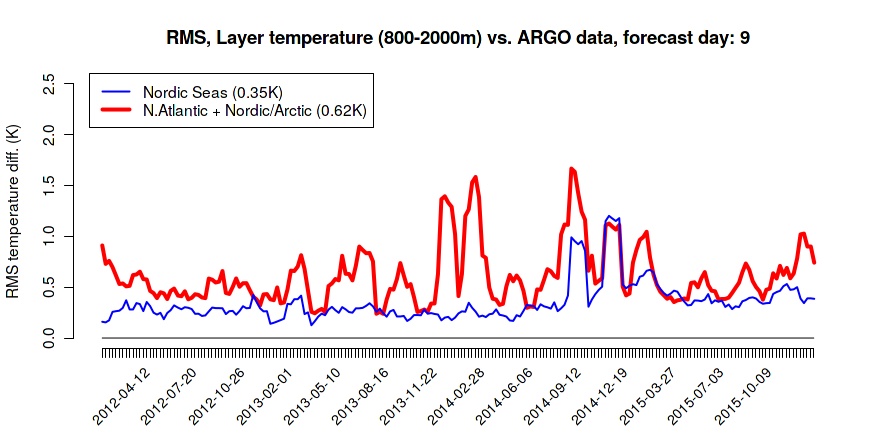
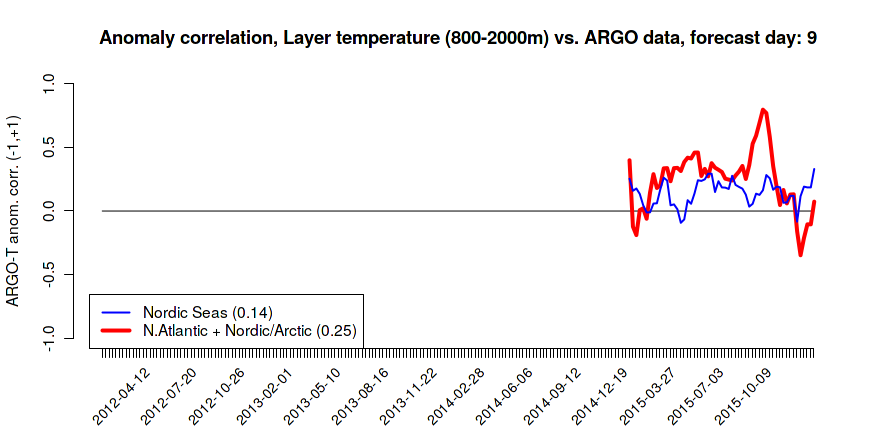
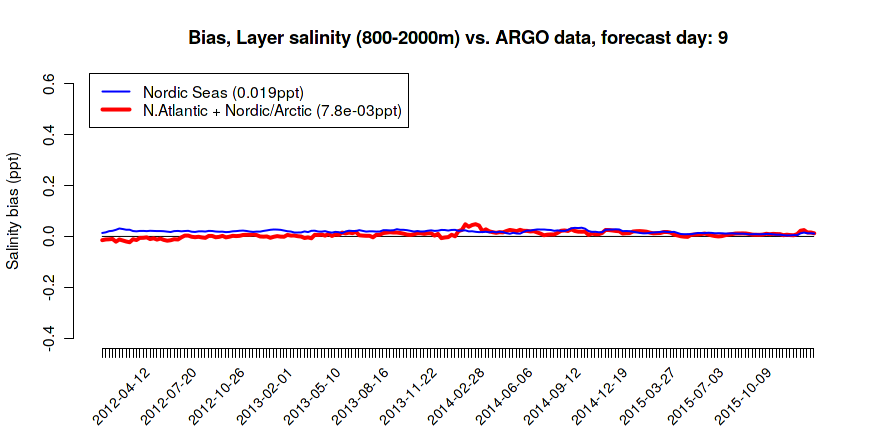
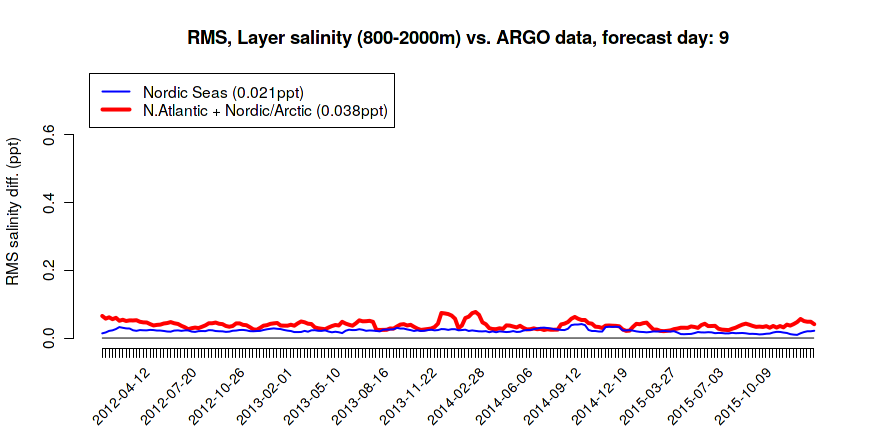
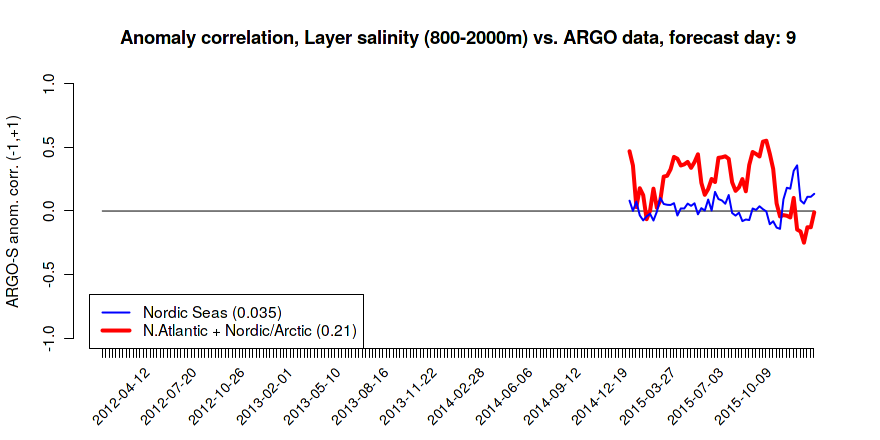
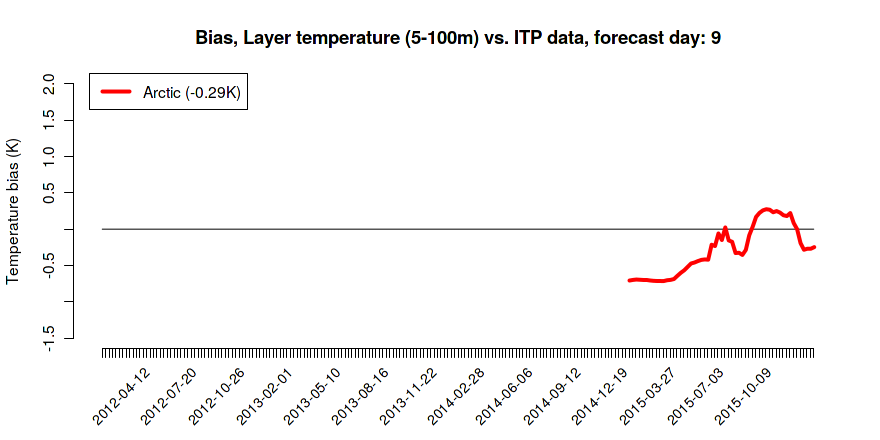
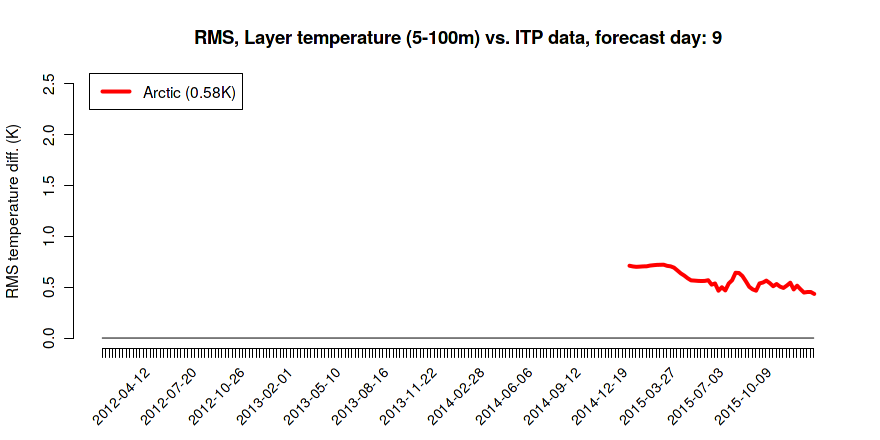
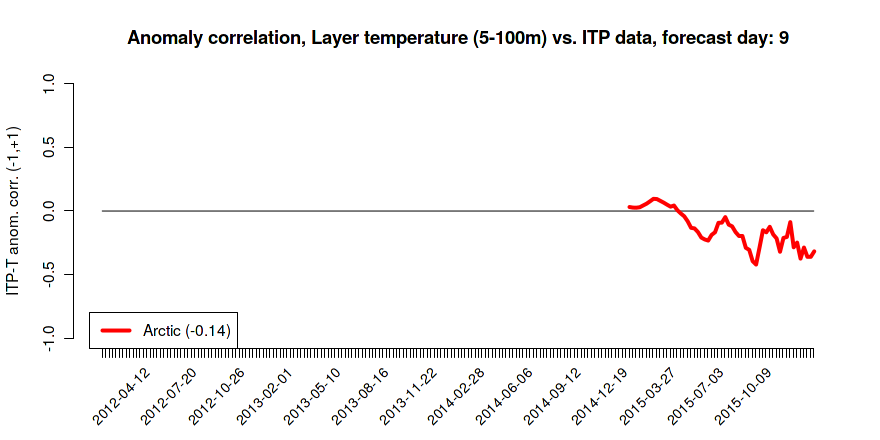
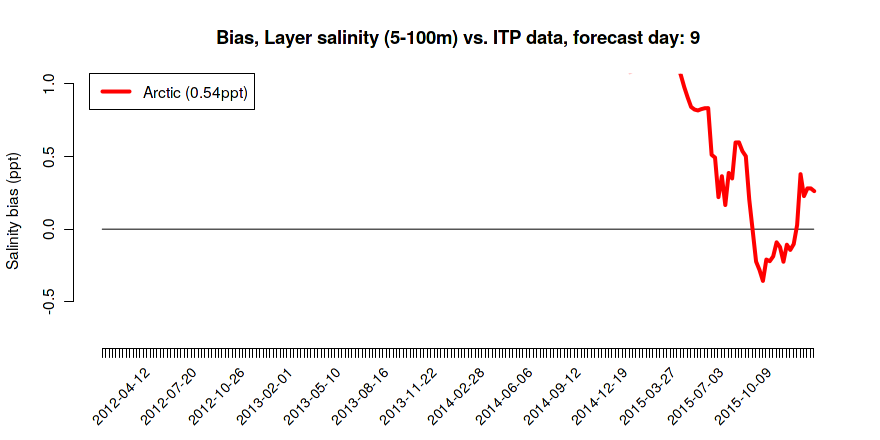
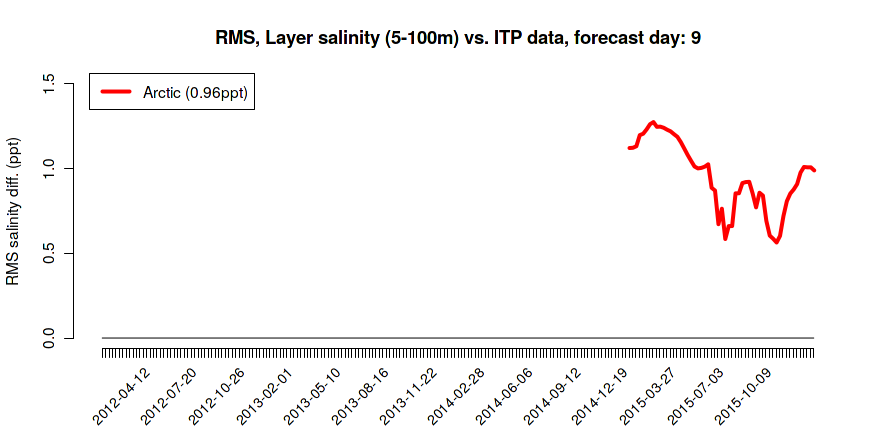
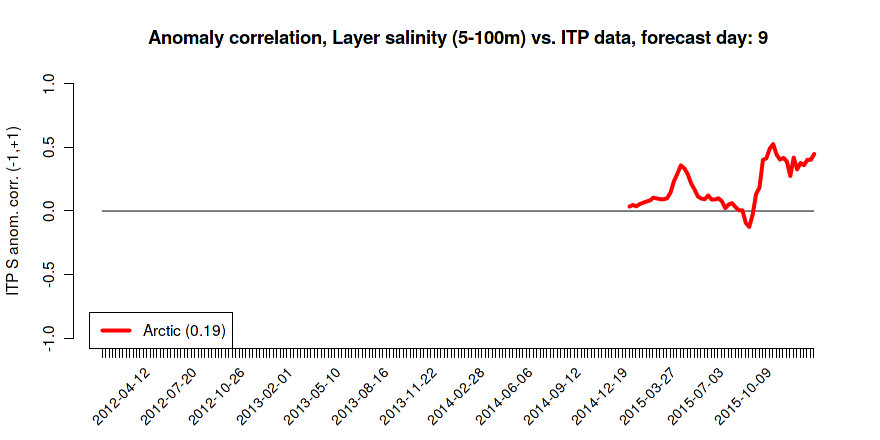
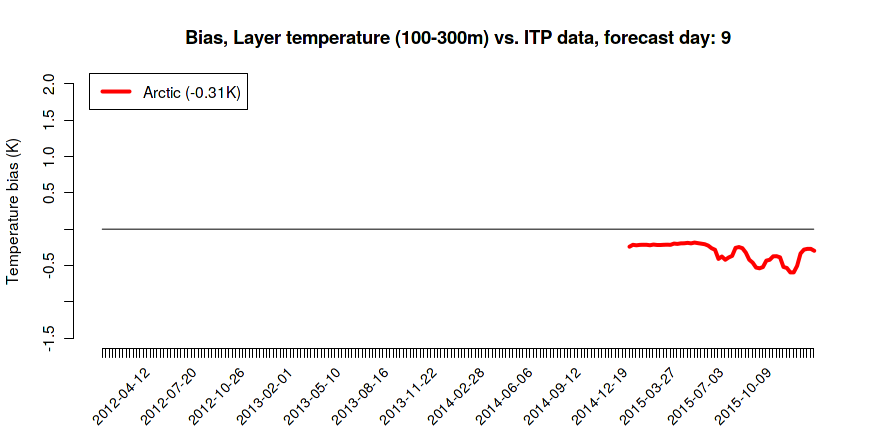
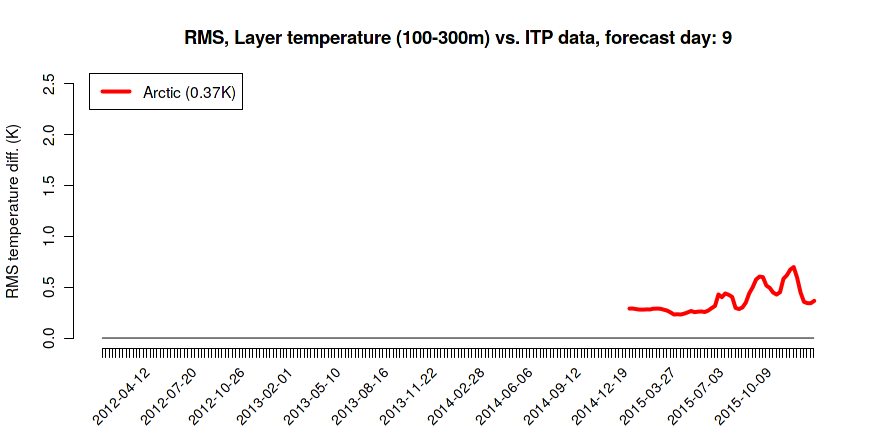
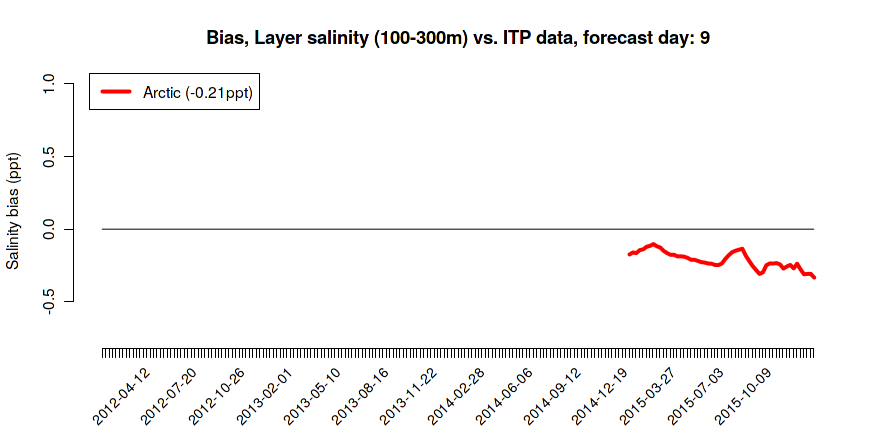
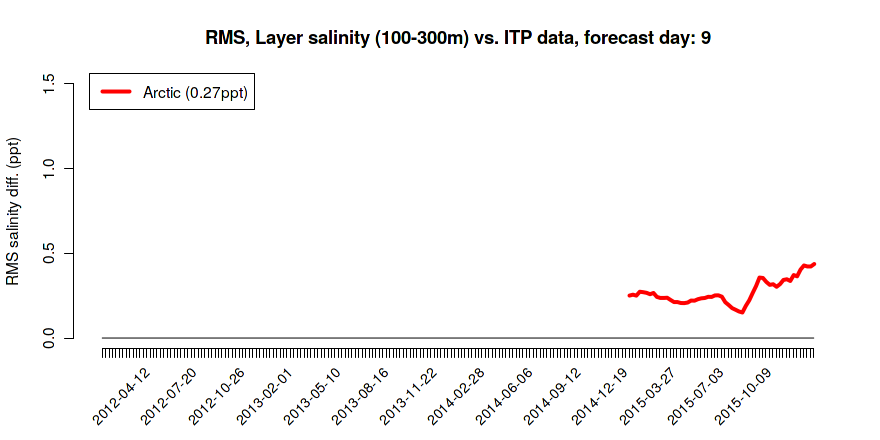
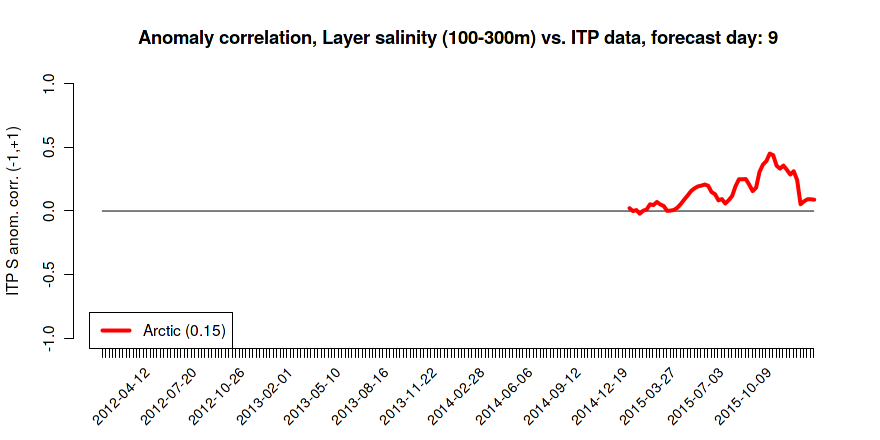
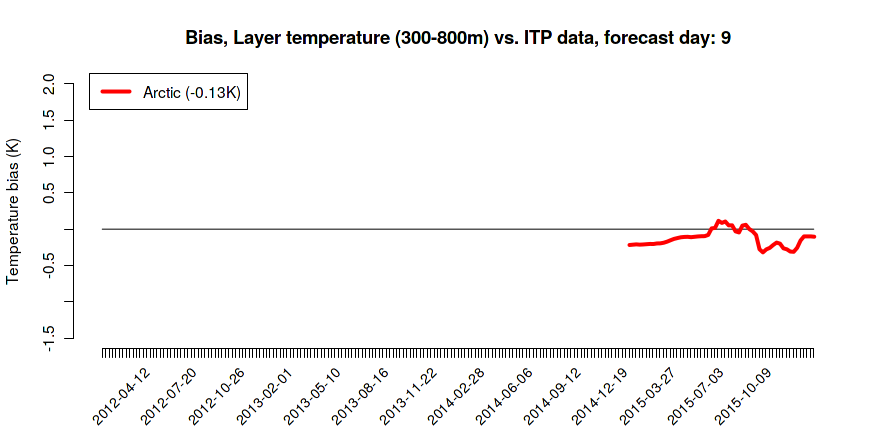
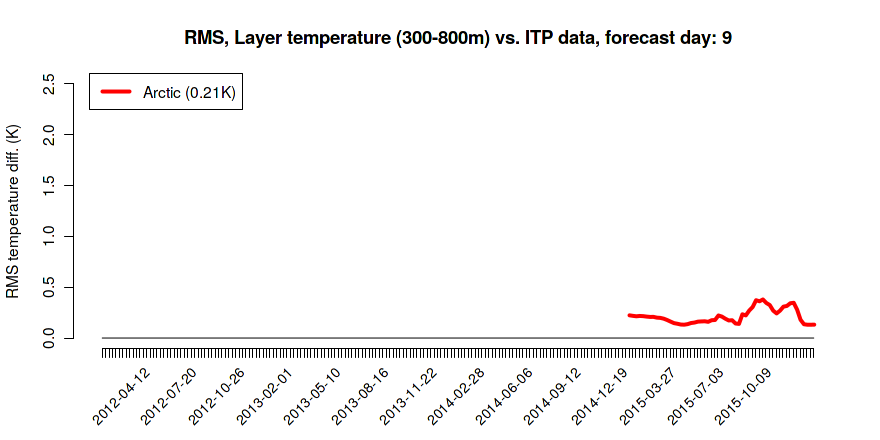
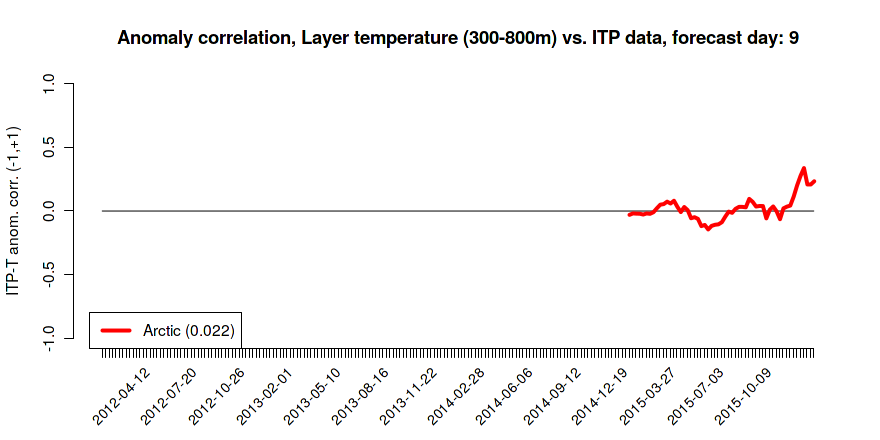
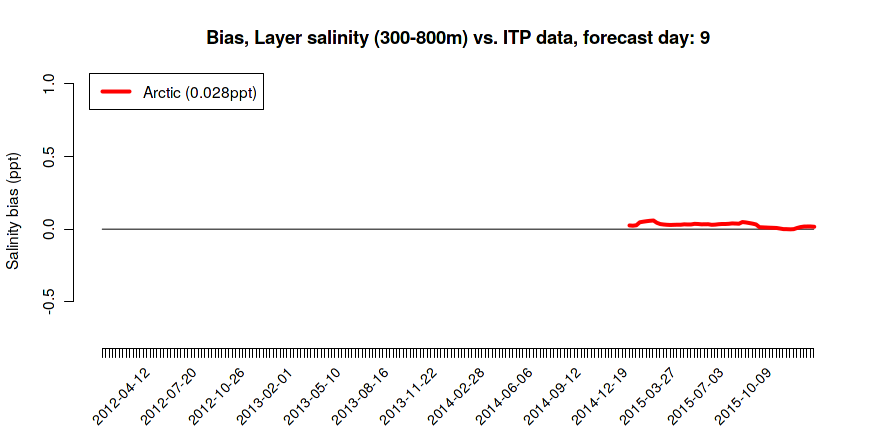
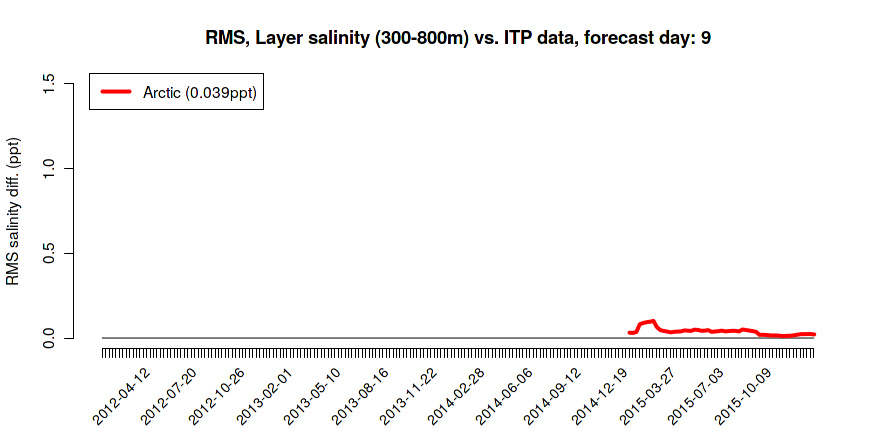
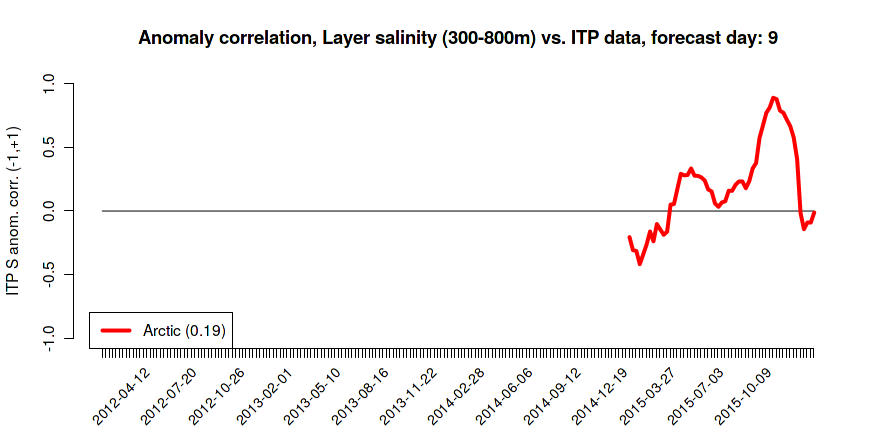
Results below are for the daily average for the 8th day after the day when the bulletin was issued. The bulletin date is given as the x-axis coordinate in the images below. Average values for the time series that are displayed, are given in parenthesis in the line label legend.
T, S profile vs. ARGO data (profiling buoys)
Information on validation data, methods, regions, and model results
Temperature, layer no. 1 (0-5 m)
Salinity, layer no. 1
Temperature, layer no. 2 (5-100 m)
Salinity, layer no. 2
Temperature, layer no. 3 (100-300 m)
Salinity, layer no. 3
Temperature, layer no. 4 (300-800 m)
Salinity, layer no. 4
Temperature, layer no. 5 (800-2000 m)
Salinity, layer no. 5
T, S profile vs. ITP data (profiling buoys)
Information on validation data, methods, regions, and model results
Temperature, layer no. 1 (5-100 m)
Salinity, layer no. 1
Temperature, layer no. 2 (100-300 m)

Salinity, layer no. 2
Temperature, layer no. 3 (300-800 m)
Salinity, layer no. 3
Generated by /metno/routine/sms/V2/timeSeries/validationTimeSeries.sh Fri Jan 1 12:39:48 UTC 2016 on arcmfc