MyOcean Arctic MFC: V1 Validation of sea ice concentration
Validation results
| October 2010
10-27 |
November 2010
11-03 11-10 11-17 11-24 |
December 2010
12-01 12-08 12-15 12-22 12-29 |
|||||||||
| January 2011
01-05 01-12 01-19 01-26 |
February 2011
02-02 02-09 02-16 02-23 |
March 2011
03-02 03-09 03-16 03-23 03-30 |
April 2011
04-06 04-13 04-20 04-27 |
May 2011
05-04 05-11 05-18 05-25 |
June 2011
06-01 06-08 06-15 06-22 06-29 |
July 2011
07-06 07-13 07-20 07-27 |
August 2011
08-03 08-10 08-17 08-24 08-31 |
September 2011
09-07 09-14 09-21 09-28 |
October 2011
10-05 10-12 10-19 10-26 |
November 2011
11-02 11-09 11-16 11-23 11-30 |
December 2011
12-07 12-14 12-21 12-28 |
| January 2012
01-04 01-11 01-18 01-25 |
February 2012
02-01 |
Documentation
These web pages contain an outline of the validation algorithm. Download this document for a detailed description of the algorithm, the observations that are used etc.Validation data
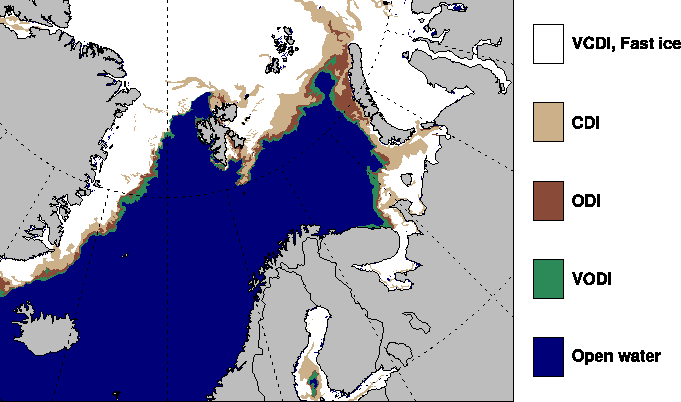
Validation of the MyOcean Arctic MFC results for sea ice concentrations is performed using the ice chart data from the MyOcean Sea ice & Wind TAC. The region for which the ice charts are available, is shown in the sample snap-shot below. Ice charts are available daily, but not for Saturdays, Sundays and public holidays in Norway. The horizontal resolution of the ice chart data is 1 km.

These sea ice classes correspond to the following sea ice concentrations (discrete values with an interval of 0.1):
- Open water: 0.0
- Very Open Drift Ice (VODI): 0.1, 0.2, 0.3
- Open Drift Ice (ODI): 0.4, 0.5, 0.6
- Close Drift Ice (CDI): 0.7, 0.8
- Very Close Drift Ice (VCDI), Fast Ice: 0.9, 1.0
Note that our model does not distunguish between classes VCDI and "Fast Ice", so these two classes are displayed by the same color above. These two classes are also merged into one class in the validation, which is referred to as Very Close Drift Ice.
Ice chart data are available as aggregated ice concentrations.
TOPAZ
The model results are produced with the TOPAZ ocean data assimilation model system. Presently, TOPAZ is run weekly with data assimillation one week prior to the bulletin date, followed by a one-week 100 member ensemble simulation ending on the bulletin date, and finally a 10 day deterministic forecast. TOPAZ was developed and is maintained by the Nansen Center.
TOPAZ results are available as aggregated, best estimates, and as a list of Bulletin dates with separate forecasts.