Copernicus Marine Service Arctic MFC: Validation of sea ice drift
Validation results: SAR sea ice displacement data
The validation results are produce for one-day ice drift by comparing drift distances from observations and model reults. The observations are available for periods that span 23-25 hours, sampled irregularly during each day. The model results are available as daily averages for each calendar day (UTC time). Note that tidal motion is not included in the model.
The observations are mapped onto the grid of the model results, which is on a polar stereographic projection, and drift distances in the model results are produced by integration of sea ice drift velocities.
In order to take into account the differences in sampling, the drift distances from the observational product is scaled (linearly) to a 24 hour period. The validation algorithm then assigns weights according to the temporal distribution between the two calendar dates that are spanned by the observations. The model velocities are then integrated in two Eulerian steps: initially, the drift distance in the model is computed for the day fraction of the first calendar date, then, the subsequent drift during the second calendar date is found by integration of drift velocities at the end point of the trajectory from the initial step.
Validation Data: Sea ice drift
Validation of the Copernicus Marine Arctic MFC results for sea ice drift is performed using the observational product from the Division of Microwaves and Remote Sensing at the Technical University of Denmark. The data are available from the Copernicus Marine Ocean Sea Ice Thematic Assembly Center (OSI TAC), and can be downloaded from Copernicus Marine as productSEAICE_GLO_SEAICE_L4_NRT_OBSERVATIONS_011_006.
These OSI TAC sea ice drift data are based on a pattern recognition algorithm which is applied to observations from Synthetic Aperture Radar (SAR) imagery.
Regions

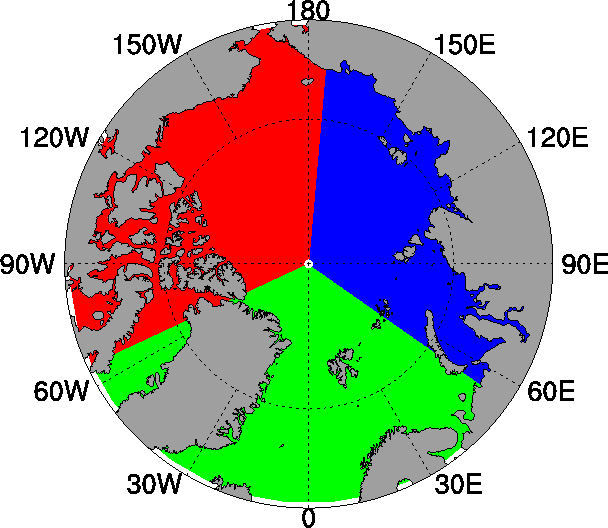
The validation of sea ice drift is carried out for the full domain (i.e., the Arctic Basin and adjacent seas), and also for a sub-division into three sectors, as displayed in the figure on the right.
- 65°W - 55°E (green sector)
- 55°E - 175°E (blue sector)
- 175°E - 65°W (red sector)
ARCMFC PHYS (TOPAZ)
The model results are produced with the TOPAZ ocean data assimilation model system. Presently, TOPAZ is run weekly with data assimillation one week prior to the bulletin date, then applying a one-week 100 member ensemble simulation ending on the bulletin date. Then, for each day a 10 day deterministic forecast is produced. TOPAZ was developed and is maintained by the Nansen Center.
ARCMFC PHYS (TOPAZ) results are available as Copernicus Marine product ARCTIC_ANALYSISFORECAST_PHY_002_001 from the Copernicus Marine Data Store. An archive of historical forecasts are available from a thredds server.
