Validation of ice thickness - Full domain
Bulletin date: 2024-01-25
Model: ARC MFC - TOPAZ
Data source: UCL CryoSAT-2 sea ice thickness
Validation statistics summary
| Bias (m) | RMS (m) | total grids | low SIT | OK SIT | high SIT | |
|---|---|---|---|---|---|---|
| Best estimate | -0.5 | 0.67 | 45708 | 7902 | 37723 | 83 |
| Day 1 forecast | -0.49 | 0.67 | 45708 | 7934 | 37689 | 85 |
| Day 4 forecast | -0.5 | 0.68 | 45708 | 8042 | 37579 | 87 |
| Day 7 forecast | -0.48 | 0.67 | 45708 | 7799 | 37814 | 95 |
| Day 10 forecast | -0.49 | 0.69 | 45708 | 8276 | 37335 | 97 |
Numbers in the three rightmost columns are grid counts. Regions with high/low sea ice thickness correspond to areas with model offsets from the gridded observations outside of one standard deviation. (Standard deviations are provided in the observational product.)
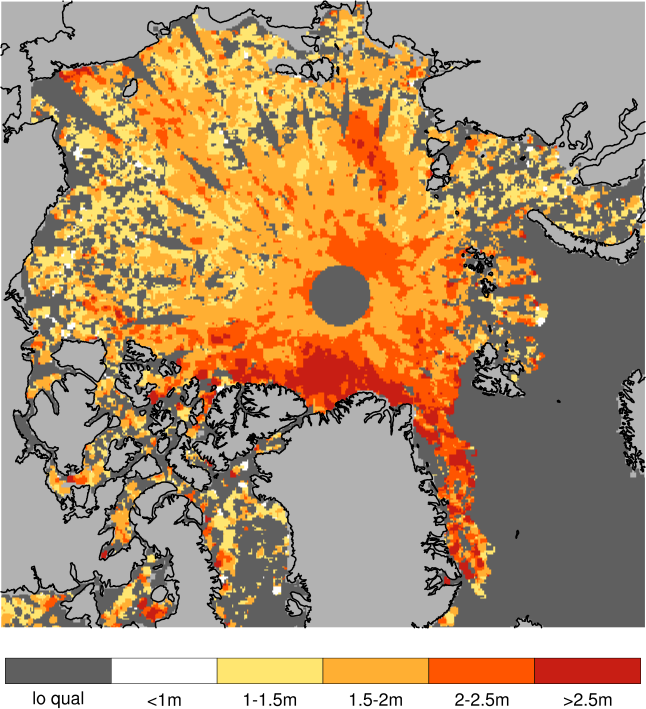
Definition of categories:
| Category | Sea ice thickness |
|---|---|
| c1 | <1m |
| c2 | 1 - 1.5m |
| c3 | 1.5 - 2m |
| c4 | 2 - 2.5m |
| c5 | 2.5 - 3m |
| c6 | >3m |
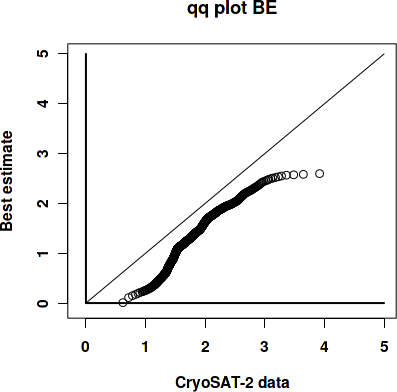
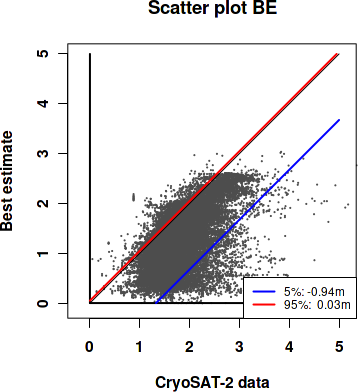
Best estimate vs. observations
Contingency table
| observations | |||||||||
|---|---|---|---|---|---|---|---|---|---|
| open | c1 | c2 | c3 | c4 | c5 | c6 | |||
| m o d e l |
open | 0 | 0 | 0 | 0 | 0 | 0 | 0 | |
| c1 | 0 | 0.01 | 0.12 | 0.093 | 0.023 | 0.006 | 0.003 | ||
| c2 | 0 | 0.001 | 0.115 | 0.267 | 0.043 | 0.006 | 0.001 | ||
| c3 | 0 | 0 | 0.008 | 0.126 | 0.096 | 0.009 | 0.002 | ||
| c4 | 0 | 0 | 0 | 0.005 | 0.028 | 0.021 | 0.005 | ||
| c5 | 0 | 0 | 0 | 0 | 0.001 | 0.006 | 0.003 | ||
| c6 | 0 | 0 | 0 | 0 | 0 | 0 | 0 | ||
See category definitions for details.
Statistical distribution
|
|
Observed sea ice thickness from CryoSAT
Sea ice thickness, best estimate product

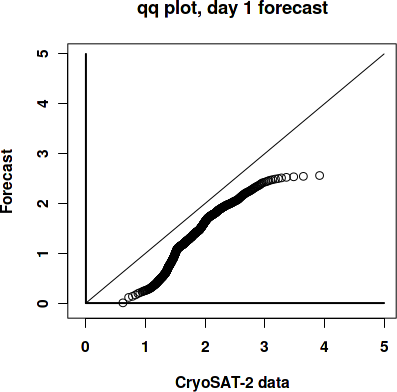
Day 1 forecast vs. observations
Contingency table
| observations | |||||||||
|---|---|---|---|---|---|---|---|---|---|
| open | c1 | c2 | c3 | c4 | c5 | c6 | |||
| m o d e l |
open | 0 | 0 | 0 | 0 | 0 | 0 | 0 | |
| c1 | 0 | 0.009 | 0.118 | 0.094 | 0.024 | 0.007 | 0.003 | ||
| c2 | 0 | 0.002 | 0.117 | 0.262 | 0.043 | 0.006 | 0.001 | ||
| c3 | 0 | 0 | 0.008 | 0.127 | 0.091 | 0.009 | 0.002 | ||
| c4 | 0 | 0 | 0 | 0.008 | 0.032 | 0.023 | 0.006 | ||
| c5 | 0 | 0 | 0 | 0 | 0.001 | 0.004 | 0.002 | ||
| c6 | 0 | 0 | 0 | 0 | 0 | 0 | 0 | ||
See category definitions for details.
Statistical distribution
|

|
Sea ice thickness, day 1 forecast
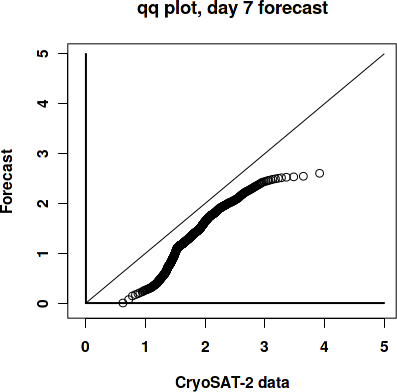
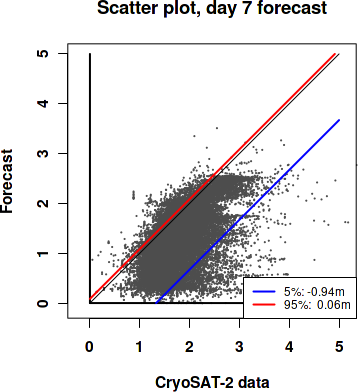
Day 7 forecast vs. observations
Contingency table
| observations | |||||||||
|---|---|---|---|---|---|---|---|---|---|
| open | c1 | c2 | c3 | c4 | c5 | c6 | |||
| m o d e l |
open | 0 | 0 | 0 | 0.001 | 0 | 0 | 0 | |
| c1 | 0 | 0.009 | 0.115 | 0.092 | 0.023 | 0.007 | 0.003 | ||
| c2 | 0 | 0.002 | 0.118 | 0.26 | 0.043 | 0.006 | 0.001 | ||
| c3 | 0 | 0 | 0.009 | 0.127 | 0.088 | 0.009 | 0.002 | ||
| c4 | 0 | 0 | 0.001 | 0.012 | 0.036 | 0.023 | 0.006 | ||
| c5 | 0 | 0 | 0 | 0 | 0.001 | 0.004 | 0.002 | ||
| c6 | 0 | 0 | 0 | 0 | 0 | 0 | 0 | ||
See category definitions for details.
Statistical distribution
|
|
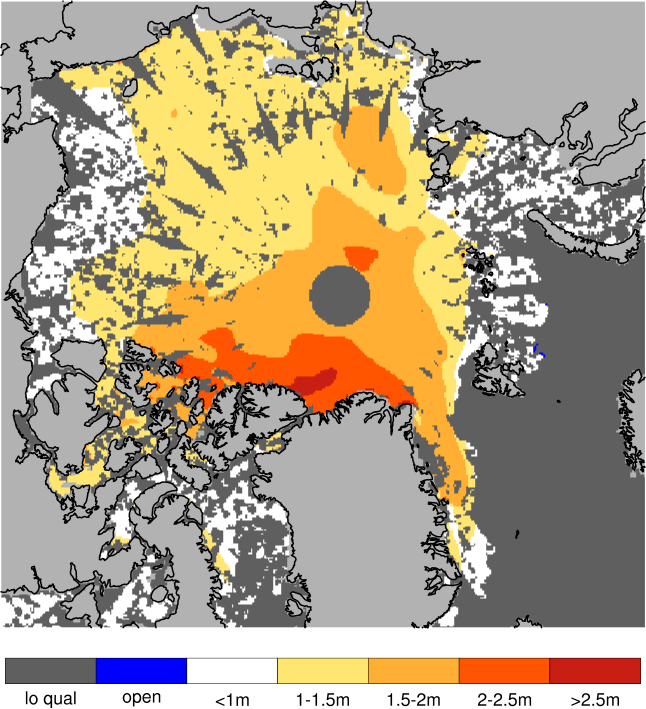
Sea ice thickness, day 7 forecast

Generated by /metno/routine/sms/V2/SIthickness/c2iceWebPage.sh Fri 09 Feb 2024 02:05:31 AM UTC on arcval