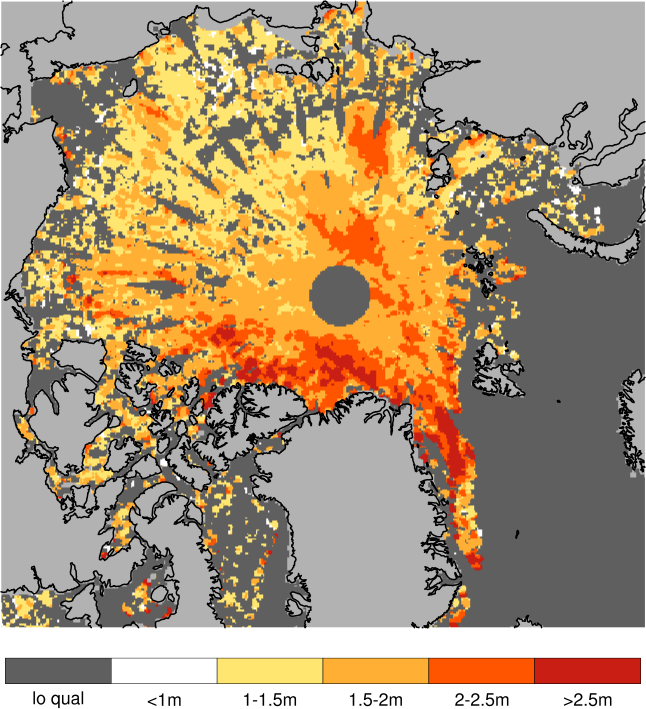
Validation of ice thickness - Full domain
Bulletin date: 2023-12-28
Model: ARC MFC - TOPAZ
Data source: UCL CryoSAT-2 sea ice thickness
Validation statistics summary
| Bias (m) | RMS (m) | total grids | low SIT | OK SIT | high SIT | |
|---|---|---|---|---|---|---|
| Best estimate | -0.48 | 0.66 | 40151 | 7162 | 32951 | 38 |
| Day 1 forecast | -0.49 | 0.67 | 40151 | 7440 | 32671 | 40 |
| Day 4 forecast | -0.5 | 0.68 | 40151 | 7664 | 32444 | 43 |
| Day 7 forecast | -0.48 | 0.67 | 40151 | 7306 | 32802 | 43 |
| Day 10 forecast | -0.5 | 0.69 | 40151 | 8149 | 31961 | 41 |
Numbers in the three rightmost columns are grid counts. Regions with high/low sea ice thickness correspond to areas with model offsets from the gridded observations outside of one standard deviation. (Standard deviations are provided in the observational product.)
Definition of categories:
| Category | Sea ice thickness |
|---|---|
| c1 | <1m |
| c2 | 1 - 1.5m |
| c3 | 1.5 - 2m |
| c4 | 2 - 2.5m |
| c5 | 2.5 - 3m |
| c6 | >3m |
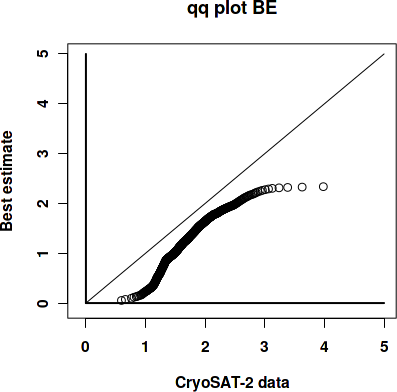
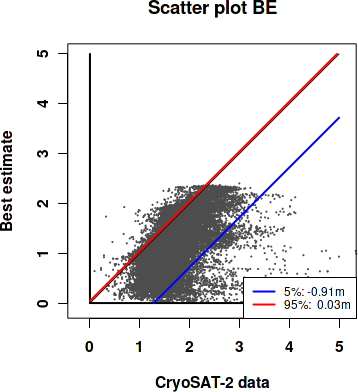
Best estimate vs. observations
Contingency table
| observations | |||||||||
|---|---|---|---|---|---|---|---|---|---|
| open | c1 | c2 | c3 | c4 | c5 | c6 | |||
| m o d e l |
open | 0 | 0 | 0 | 0 | 0 | 0 | 0 | |
| c1 | 0 | 0.02 | 0.204 | 0.11 | 0.013 | 0.004 | 0.003 | ||
| c2 | 0 | 0.001 | 0.139 | 0.194 | 0.032 | 0.008 | 0.003 | ||
| c3 | 0 | 0 | 0.01 | 0.135 | 0.075 | 0.009 | 0.002 | ||
| c4 | 0 | 0 | 0 | 0.003 | 0.022 | 0.014 | 0.002 | ||
| c5 | 0 | 0 | 0 | 0 | 0 | 0 | 0 | ||
| c6 | 0 | 0 | 0 | 0 | 0 | 0 | 0 | ||
See category definitions for details.
Statistical distribution
|
|
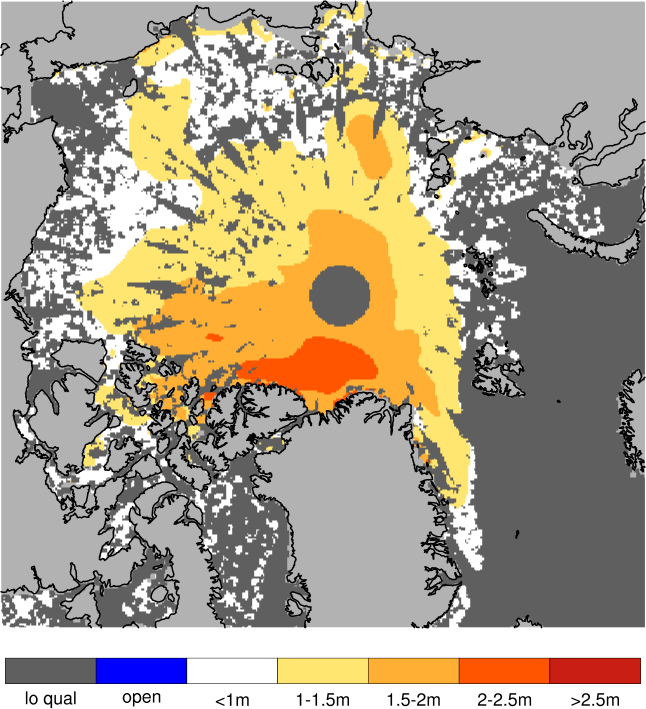
Observed sea ice thickness from CryoSAT
Sea ice thickness, best estimate product

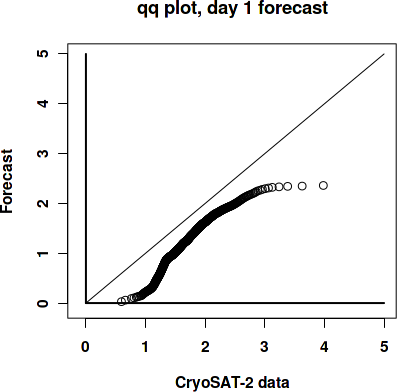
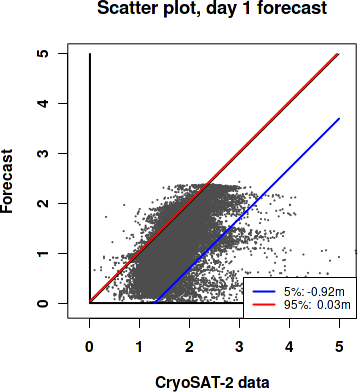
Day 1 forecast vs. observations
Contingency table
| observations | |||||||||
|---|---|---|---|---|---|---|---|---|---|
| open | c1 | c2 | c3 | c4 | c5 | c6 | |||
| m o d e l |
open | 0 | 0 | 0 | 0 | 0 | 0 | 0 | |
| c1 | 0 | 0.02 | 0.204 | 0.11 | 0.013 | 0.004 | 0.003 | ||
| c2 | 0 | 0.001 | 0.139 | 0.198 | 0.034 | 0.009 | 0.003 | ||
| c3 | 0 | 0 | 0.01 | 0.129 | 0.072 | 0.007 | 0.001 | ||
| c4 | 0 | 0 | 0 | 0.004 | 0.023 | 0.014 | 0.002 | ||
| c5 | 0 | 0 | 0 | 0 | 0 | 0 | 0 | ||
| c6 | 0 | 0 | 0 | 0 | 0 | 0 | 0 | ||
See category definitions for details.
Statistical distribution
|
|
Sea ice thickness, day 1 forecast
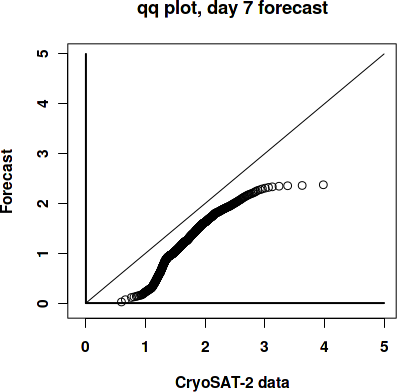
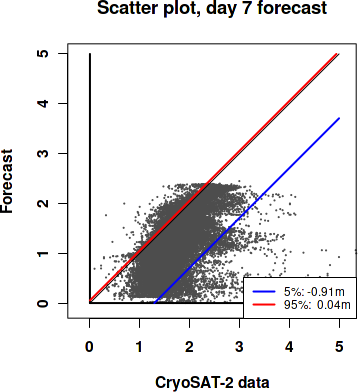
Day 7 forecast vs. observations
Contingency table
| observations | |||||||||
|---|---|---|---|---|---|---|---|---|---|
| open | c1 | c2 | c3 | c4 | c5 | c6 | |||
| m o d e l |
open | 0 | 0 | 0 | 0 | 0 | 0 | 0 | |
| c1 | 0 | 0.02 | 0.187 | 0.105 | 0.013 | 0.004 | 0.003 | ||
| c2 | 0 | 0.001 | 0.155 | 0.2 | 0.034 | 0.01 | 0.003 | ||
| c3 | 0 | 0 | 0.01 | 0.131 | 0.069 | 0.007 | 0.001 | ||
| c4 | 0 | 0 | 0 | 0.005 | 0.025 | 0.014 | 0.002 | ||
| c5 | 0 | 0 | 0 | 0 | 0 | 0 | 0 | ||
| c6 | 0 | 0 | 0 | 0 | 0 | 0 | 0 | ||
See category definitions for details.
Statistical distribution
|
|
Sea ice thickness, day 7 forecast

Generated by /metno/routine/sms/V2/SIthickness/c2iceWebPage.sh Fri 12 Jan 2024 02:04:24 AM UTC on arcval