Validation of ice thickness - Full domain
Bulletin date: 2023-03-02
Model: ARC MFC - TOPAZ
Data source: UCL CryoSAT-2 sea ice thickness
Validation statistics summary
| Bias (m) | RMS (m) | total grids | low SIT | OK SIT | high SIT | |
|---|---|---|---|---|---|---|
| Best estimate | -0.5 | 0.82 | 47879 | 6938 | 40750 | 191 |
| Day 1 forecast | -0.5 | 0.82 | 47879 | 6948 | 40720 | 211 |
| Day 4 forecast | -0.5 | 0.82 | 47879 | 7034 | 40633 | 212 |
| Day 7 forecast | -0.49 | 0.82 | 47879 | 6811 | 40846 | 222 |
| Day 10 forecast | -0.48 | 0.82 | 47879 | 6925 | 40725 | 229 |
Numbers in the three rightmost columns are grid counts. Regions with high/low sea ice thickness correspond to areas with model offsets from the gridded observations outside of one standard deviation. (Standard deviations are provided in the observational product.)
Definition of categories:
| Category | Sea ice thickness |
|---|---|
| c1 | <1m |
| c2 | 1 - 1.5m |
| c3 | 1.5 - 2m |
| c4 | 2 - 2.5m |
| c5 | 2.5 - 3m |
| c6 | >3m |
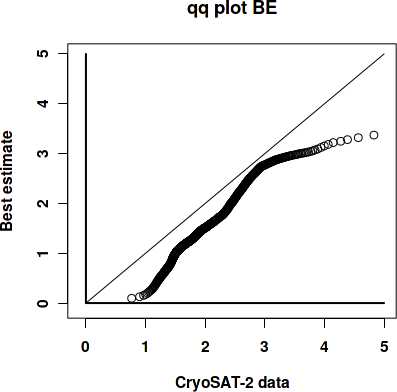
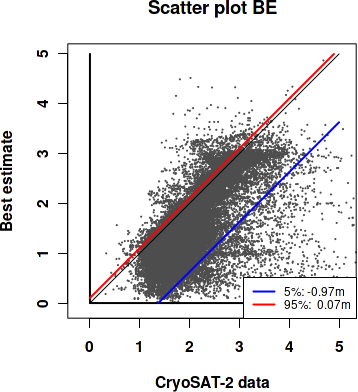
Best estimate vs. observations
Contingency table
| observations | |||||||||
|---|---|---|---|---|---|---|---|---|---|
| open | c1 | c2 | c3 | c4 | c5 | c6 | |||
| m o d e l |
open | 0 | 0 | 0 | 0 | 0 | 0 | 0 | |
| c1 | 0 | 0.003 | 0.064 | 0.09 | 0.02 | 0.005 | 0.007 | ||
| c2 | 0 | 0.001 | 0.11 | 0.267 | 0.043 | 0.007 | 0.005 | ||
| c3 | 0 | 0 | 0.004 | 0.085 | 0.07 | 0.007 | 0.006 | ||
| c4 | 0 | 0 | 0.001 | 0.005 | 0.036 | 0.03 | 0.008 | ||
| c5 | 0 | 0 | 0 | 0.001 | 0.009 | 0.06 | 0.033 | ||
| c6 | 0 | 0 | 0 | 0.001 | 0.003 | 0.005 | 0.012 | ||
See category definitions for details.
Statistical distribution
|
|
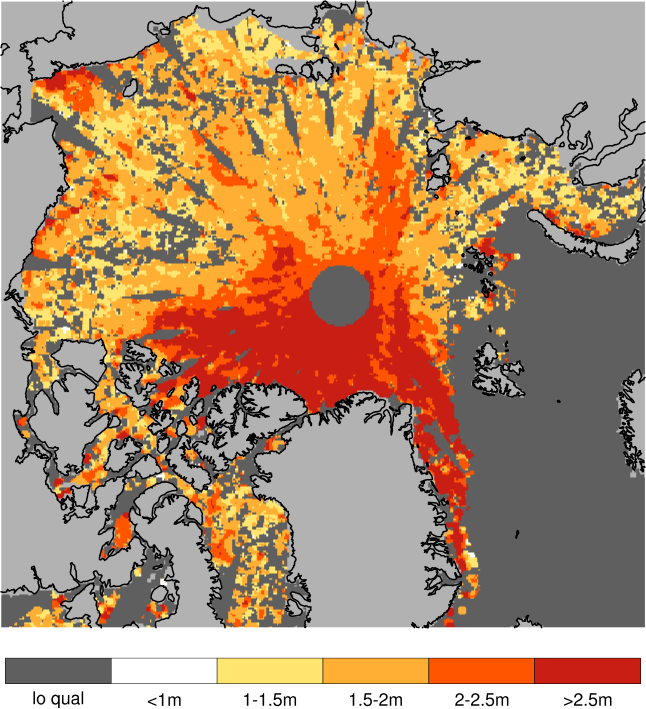
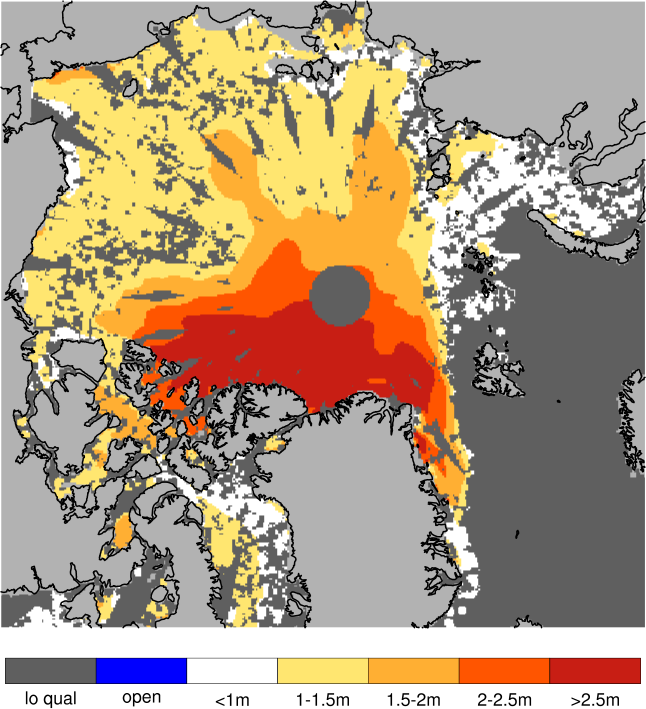
Observed sea ice thickness from CryoSAT
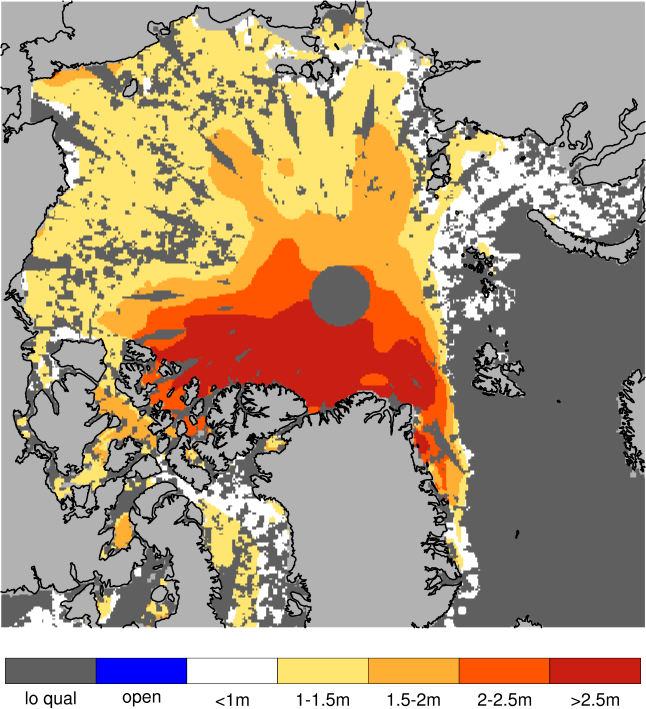
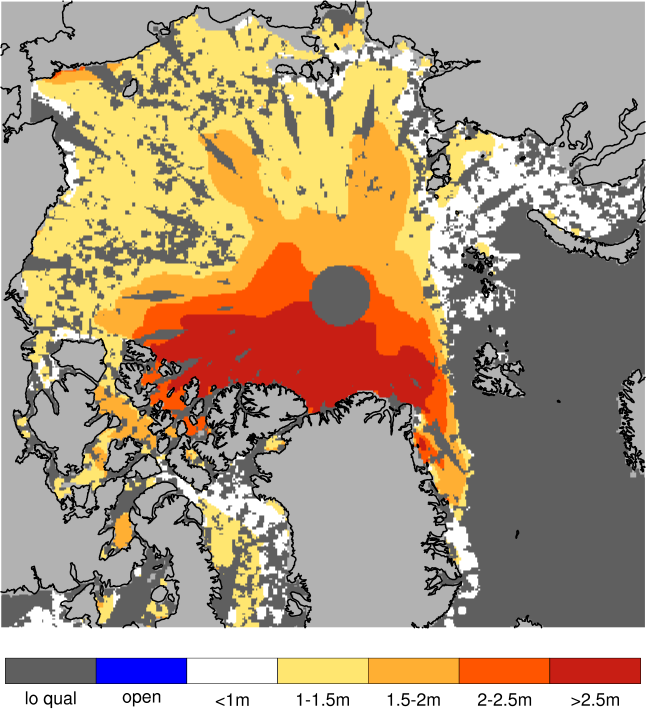
Sea ice thickness, best estimate product
Day 1 forecast vs. observations
Contingency table
| observations | |||||||||
|---|---|---|---|---|---|---|---|---|---|
| open | c1 | c2 | c3 | c4 | c5 | c6 | |||
| m o d e l |
open | 0 | 0 | 0 | 0 | 0 | 0 | 0 | |
| c1 | 0 | 0.003 | 0.062 | 0.091 | 0.02 | 0.005 | 0.007 | ||
| c2 | 0 | 0.001 | 0.111 | 0.266 | 0.043 | 0.008 | 0.005 | ||
| c3 | 0 | 0 | 0.005 | 0.085 | 0.07 | 0.008 | 0.007 | ||
| c4 | 0 | 0 | 0.001 | 0.006 | 0.036 | 0.028 | 0.007 | ||
| c5 | 0 | 0 | 0 | 0.001 | 0.01 | 0.061 | 0.034 | ||
| c6 | 0 | 0 | 0 | 0.001 | 0.003 | 0.004 | 0.011 | ||
See category definitions for details.
Statistical distribution
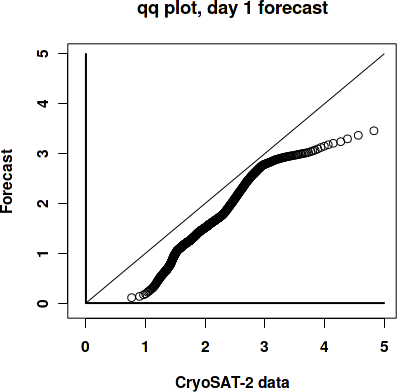
|

|
Sea ice thickness, day 1 forecast
Day 7 forecast vs. observations
Contingency table
| observations | |||||||||
|---|---|---|---|---|---|---|---|---|---|
| open | c1 | c2 | c3 | c4 | c5 | c6 | |||
| m o d e l |
open | 0 | 0 | 0 | 0 | 0 | 0 | 0 | |
| c1 | 0 | 0.003 | 0.06 | 0.088 | 0.019 | 0.005 | 0.007 | ||
| c2 | 0 | 0.001 | 0.112 | 0.262 | 0.042 | 0.007 | 0.005 | ||
| c3 | 0 | 0 | 0.005 | 0.09 | 0.073 | 0.009 | 0.007 | ||
| c4 | 0 | 0 | 0.001 | 0.007 | 0.035 | 0.027 | 0.007 | ||
| c5 | 0 | 0 | 0 | 0.001 | 0.009 | 0.06 | 0.032 | ||
| c6 | 0 | 0 | 0 | 0.001 | 0.004 | 0.006 | 0.013 | ||
See category definitions for details.
Statistical distribution
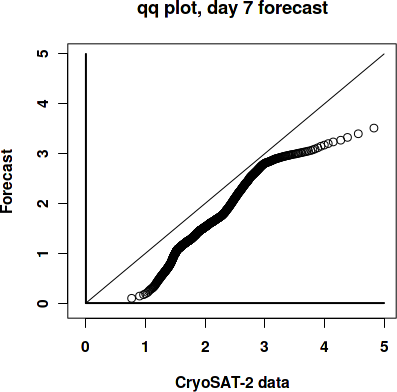
|
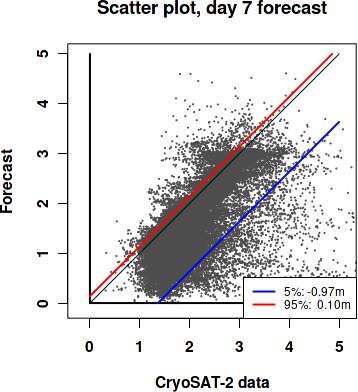
|
Sea ice thickness, day 7 forecast
Generated by /metno/routine/sms/V2/SIthickness/c2iceWebPage.sh ma. 18. sep. 11:18:29 +0000 2023 on arcval