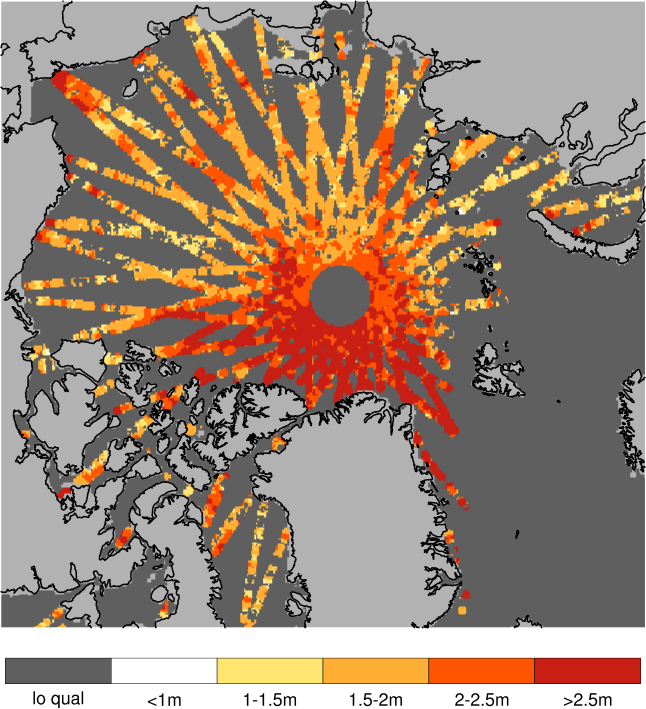
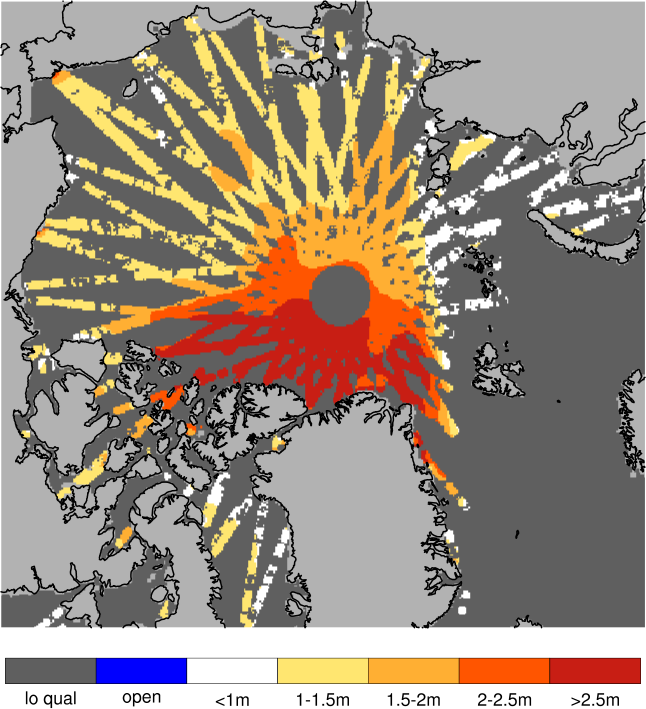
Validation of ice thickness - Full domain
Bulletin date: 2023-02-23
Model: ARC MFC - TOPAZ
Data source: UCL CryoSAT-2 sea ice thickness
Validation statistics summary
| Bias (m) | RMS (m) | total grids | low SIT | OK SIT | high SIT | |
|---|---|---|---|---|---|---|
| Best estimate | -0.5 | 0.89 | 24679 | 4516 | 20000 | 163 |
| Day 1 forecast | -0.5 | 0.89 | 24679 | 4474 | 20021 | 184 |
| Day 4 forecast | -0.5 | 0.89 | 24679 | 4532 | 19970 | 177 |
| Day 7 forecast | -0.48 | 0.88 | 24679 | 4373 | 20101 | 205 |
| Day 10 forecast | -0.49 | 0.9 | 24679 | 4664 | 19833 | 182 |
Numbers in the three rightmost columns are grid counts. Regions with high/low sea ice thickness correspond to areas with model offsets from the gridded observations outside of one standard deviation. (Standard deviations are provided in the observational product.)
Definition of categories:
| Category | Sea ice thickness |
|---|---|
| c1 | <1m |
| c2 | 1 - 1.5m |
| c3 | 1.5 - 2m |
| c4 | 2 - 2.5m |
| c5 | 2.5 - 3m |
| c6 | >3m |
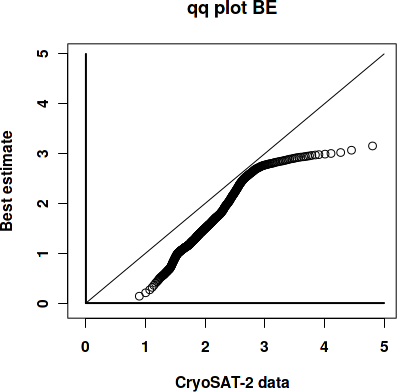
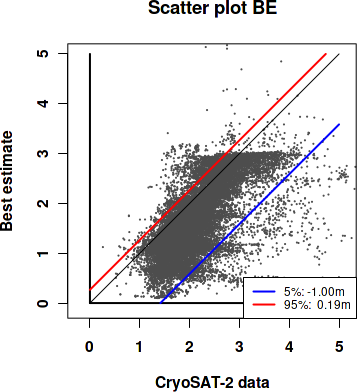
Best estimate vs. observations
Contingency table
| observations | |||||||||
|---|---|---|---|---|---|---|---|---|---|
| open | c1 | c2 | c3 | c4 | c5 | c6 | |||
| m o d e l |
open | 0 | 0 | 0 | 0 | 0 | 0 | 0 | |
| c1 | 0 | 0.002 | 0.044 | 0.068 | 0.021 | 0.006 | 0.005 | ||
| c2 | 0 | 0.001 | 0.064 | 0.226 | 0.067 | 0.01 | 0.006 | ||
| c3 | 0 | 0 | 0.004 | 0.093 | 0.084 | 0.015 | 0.006 | ||
| c4 | 0 | 0 | 0 | 0.012 | 0.05 | 0.038 | 0.009 | ||
| c5 | 0 | 0 | 0 | 0.004 | 0.032 | 0.07 | 0.049 | ||
| c6 | 0 | 0 | 0 | 0.001 | 0.001 | 0.003 | 0.006 | ||
See category definitions for details.
Statistical distribution
|
|
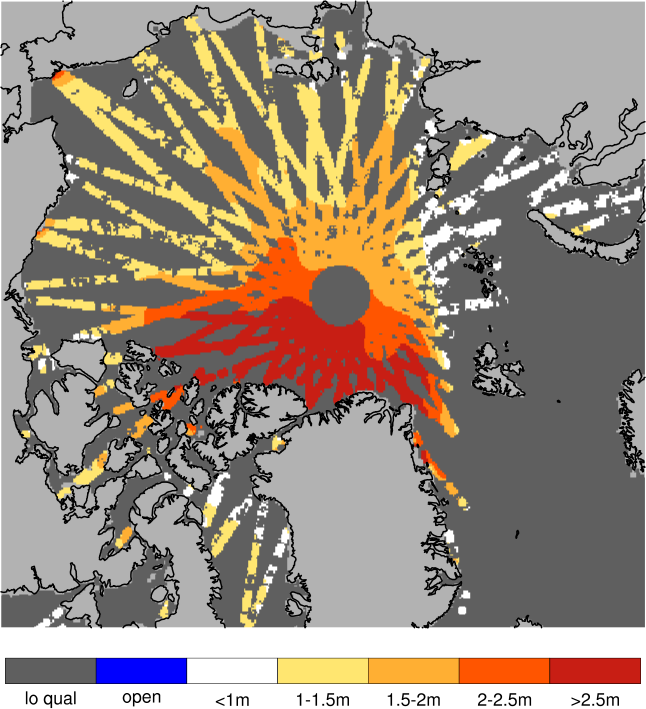
Observed sea ice thickness from CryoSAT
Sea ice thickness, best estimate product
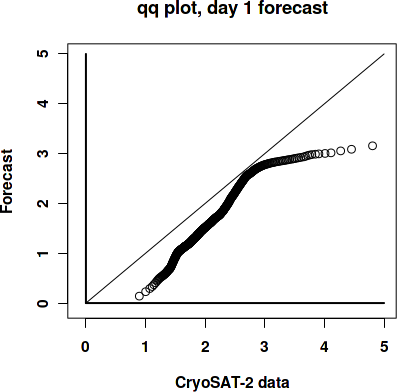
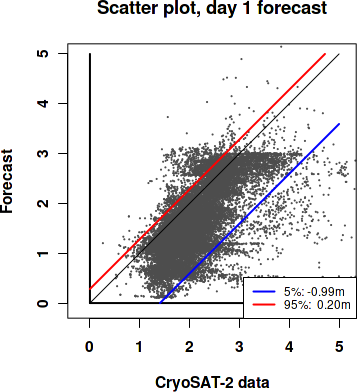
Day 1 forecast vs. observations
Contingency table
| observations | |||||||||
|---|---|---|---|---|---|---|---|---|---|
| open | c1 | c2 | c3 | c4 | c5 | c6 | |||
| m o d e l |
open | 0 | 0 | 0 | 0 | 0 | 0 | 0 | |
| c1 | 0 | 0.002 | 0.043 | 0.065 | 0.021 | 0.005 | 0.005 | ||
| c2 | 0 | 0.002 | 0.064 | 0.22 | 0.066 | 0.011 | 0.005 | ||
| c3 | 0 | 0 | 0.006 | 0.101 | 0.089 | 0.016 | 0.007 | ||
| c4 | 0 | 0 | 0 | 0.013 | 0.046 | 0.038 | 0.01 | ||
| c5 | 0 | 0 | 0 | 0.005 | 0.03 | 0.068 | 0.048 | ||
| c6 | 0 | 0 | 0 | 0.001 | 0.003 | 0.004 | 0.006 | ||
See category definitions for details.
Statistical distribution
|
|
Sea ice thickness, day 1 forecast
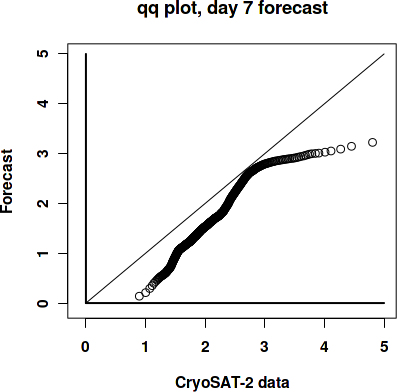
Day 7 forecast vs. observations
Contingency table
| observations | |||||||||
|---|---|---|---|---|---|---|---|---|---|
| open | c1 | c2 | c3 | c4 | c5 | c6 | |||
| m o d e l |
open | 0 | 0 | 0 | 0 | 0 | 0 | 0 | |
| c1 | 0 | 0.002 | 0.042 | 0.062 | 0.02 | 0.005 | 0.005 | ||
| c2 | 0 | 0.002 | 0.064 | 0.216 | 0.066 | 0.011 | 0.005 | ||
| c3 | 0 | 0 | 0.006 | 0.107 | 0.092 | 0.017 | 0.007 | ||
| c4 | 0 | 0 | 0 | 0.013 | 0.044 | 0.037 | 0.011 | ||
| c5 | 0 | 0 | 0 | 0.005 | 0.03 | 0.067 | 0.045 | ||
| c6 | 0 | 0 | 0 | 0.001 | 0.003 | 0.005 | 0.009 | ||
See category definitions for details.
Statistical distribution
|

|
Sea ice thickness, day 7 forecast
Generated by /metno/routine/sms/V2/SIthickness/c2iceWebPage.sh ma. 18. sep. 11:12:37 +0000 2023 on arcval