Validation of ice thickness - Full domain
Bulletin date: 2023-01-12
Model: ARC MFC - TOPAZ
Data source: UCL CryoSAT-2 sea ice thickness
Validation statistics summary
| Bias (m) | RMS (m) | total grids | low SIT | OK SIT | high SIT | |
|---|---|---|---|---|---|---|
| Best estimate | -0.33 | 0.61 | 19131 | 3029 | 15739 | 363 |
| Day 1 forecast | -0.33 | 0.61 | 19131 | 3051 | 15698 | 382 |
| Day 4 forecast | -0.34 | 0.61 | 19131 | 3077 | 15689 | 365 |
| Day 7 forecast | -0.32 | 0.61 | 19131 | 3049 | 15687 | 395 |
| Day 10 forecast | -0.35 | 0.63 | 19131 | 3212 | 15509 | 410 |
Numbers in the three rightmost columns are grid counts. Regions with high/low sea ice thickness correspond to areas with model offsets from the gridded observations outside of one standard deviation. (Standard deviations are provided in the observational product.)
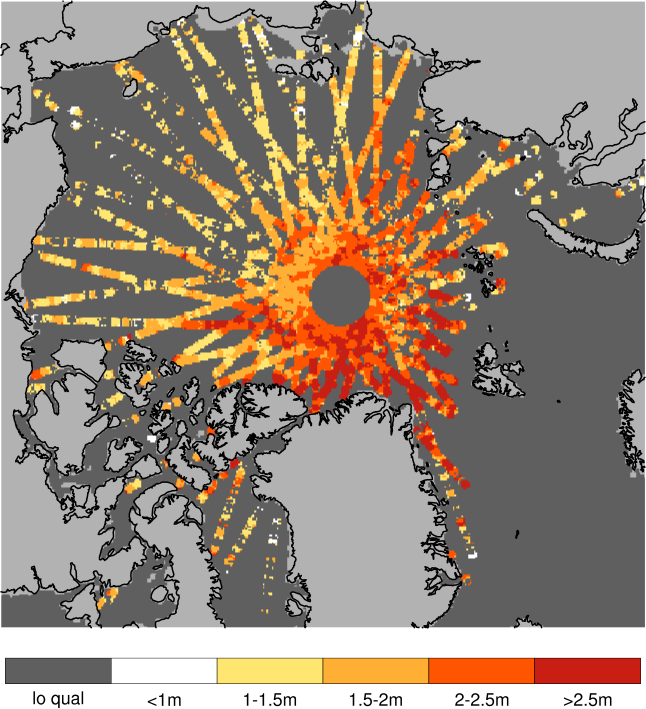
Definition of categories:
| Category | Sea ice thickness |
|---|---|
| c1 | <1m |
| c2 | 1 - 1.5m |
| c3 | 1.5 - 2m |
| c4 | 2 - 2.5m |
| c5 | 2.5 - 3m |
| c6 | >3m |
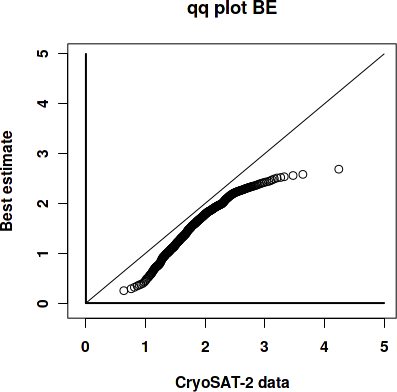
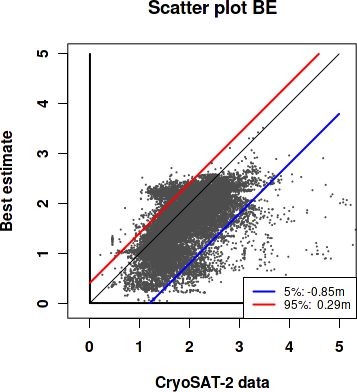
Best estimate vs. observations
Contingency table
| observations | |||||||||
|---|---|---|---|---|---|---|---|---|---|
| open | c1 | c2 | c3 | c4 | c5 | c6 | |||
| m o d e l |
open | 0 | 0 | 0 | 0 | 0 | 0 | 0 | |
| c1 | 0 | 0.015 | 0.084 | 0.055 | 0.018 | 0.003 | 0.002 | ||
| c2 | 0 | 0.008 | 0.129 | 0.102 | 0.024 | 0.005 | 0.003 | ||
| c3 | 0 | 0.001 | 0.023 | 0.134 | 0.122 | 0.034 | 0.01 | ||
| c4 | 0 | 0 | 0.017 | 0.048 | 0.08 | 0.055 | 0.01 | ||
| c5 | 0 | 0 | 0 | 0 | 0.006 | 0.006 | 0.004 | ||
| c6 | 0 | 0 | 0 | 0 | 0 | 0 | 0 | ||
See category definitions for details.
Statistical distribution
|
|
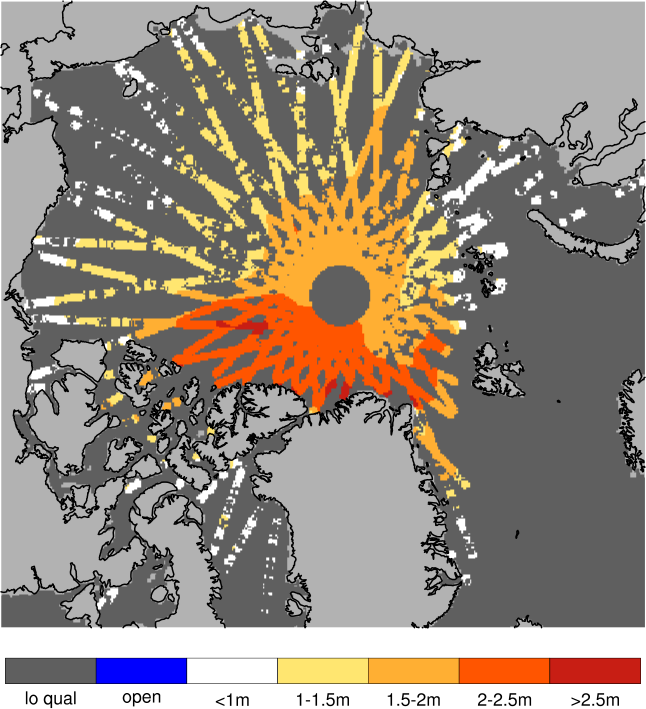
Observed sea ice thickness from CryoSAT
Sea ice thickness, best estimate product

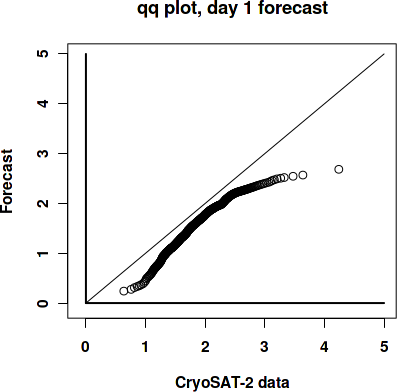
Day 1 forecast vs. observations
Contingency table
| observations | |||||||||
|---|---|---|---|---|---|---|---|---|---|
| open | c1 | c2 | c3 | c4 | c5 | c6 | |||
| m o d e l |
open | 0 | 0 | 0 | 0 | 0 | 0 | 0 | |
| c1 | 0 | 0.014 | 0.076 | 0.052 | 0.018 | 0.003 | 0.001 | ||
| c2 | 0 | 0.009 | 0.136 | 0.107 | 0.026 | 0.006 | 0.004 | ||
| c3 | 0 | 0.001 | 0.023 | 0.131 | 0.123 | 0.036 | 0.01 | ||
| c4 | 0 | 0 | 0.018 | 0.049 | 0.08 | 0.054 | 0.011 | ||
| c5 | 0 | 0 | 0 | 0 | 0.004 | 0.004 | 0.003 | ||
| c6 | 0 | 0 | 0 | 0 | 0 | 0 | 0 | ||
See category definitions for details.
Statistical distribution
|

|
Sea ice thickness, day 1 forecast
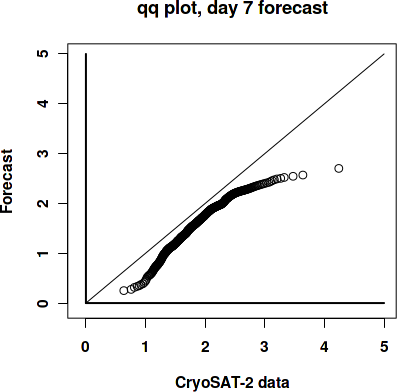
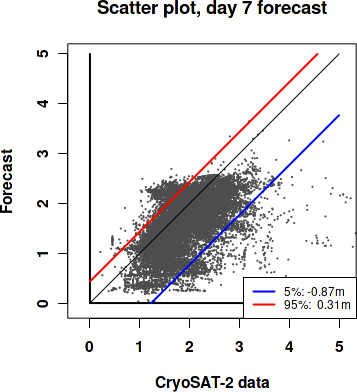
Day 7 forecast vs. observations
Contingency table
| observations | |||||||||
|---|---|---|---|---|---|---|---|---|---|
| open | c1 | c2 | c3 | c4 | c5 | c6 | |||
| m o d e l |
open | 0 | 0 | 0 | 0 | 0 | 0 | 0 | |
| c1 | 0 | 0.013 | 0.068 | 0.049 | 0.018 | 0.003 | 0.002 | ||
| c2 | 0 | 0.01 | 0.142 | 0.108 | 0.026 | 0.007 | 0.005 | ||
| c3 | 0 | 0.001 | 0.025 | 0.13 | 0.124 | 0.036 | 0.008 | ||
| c4 | 0 | 0 | 0.018 | 0.052 | 0.079 | 0.052 | 0.011 | ||
| c5 | 0 | 0 | 0 | 0 | 0.004 | 0.004 | 0.003 | ||
| c6 | 0 | 0 | 0 | 0 | 0 | 0 | 0 | ||
See category definitions for details.
Statistical distribution
|
|
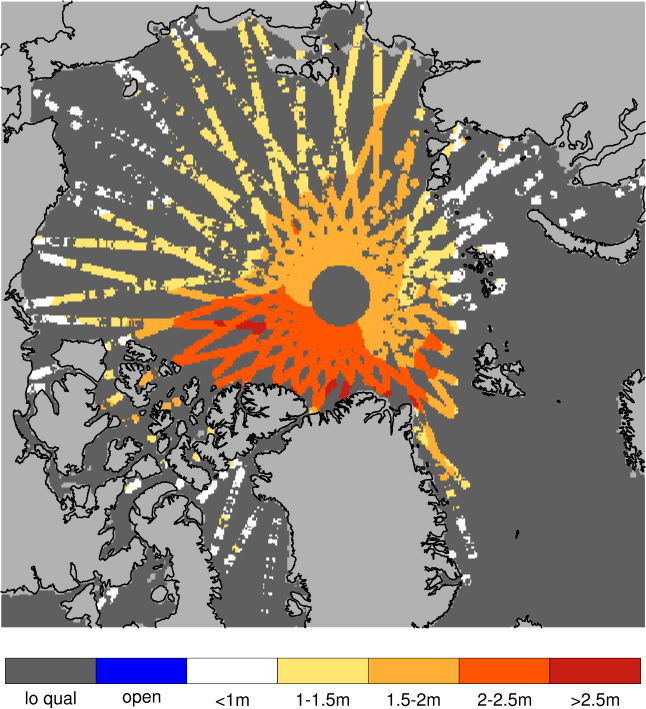
Sea ice thickness, day 7 forecast
Generated by /metno/routine/sms/V2/SIthickness/c2iceWebPage.sh ma. 18. sep. 11:06:44 +0000 2023 on arcval