Validation of ice thickness - Full domain
Bulletin date: 2022-12-08
Model: ARC MFC - TOPAZ
Data source: UCL CryoSAT-2 sea ice thickness
Validation statistics summary
| Bias (m) | RMS (m) | total grids | low SIT | OK SIT | high SIT | |
|---|---|---|---|---|---|---|
| Best estimate | -0.46 | 0.66 | 35126 | 7591 | 27335 | 200 |
| Day 1 forecast | -0.46 | 0.66 | 35126 | 7654 | 27286 | 186 |
| Day 4 forecast | -0.46 | 0.67 | 35126 | 7800 | 27150 | 176 |
| Day 7 forecast | -0.45 | 0.65 | 35126 | 7400 | 27526 | 200 |
| Day 10 forecast | -0.48 | 0.68 | 35126 | 8308 | 26659 | 159 |
Numbers in the three rightmost columns are grid counts. Regions with high/low sea ice thickness correspond to areas with model offsets from the gridded observations outside of one standard deviation. (Standard deviations are provided in the observational product.)
Definition of categories:
| Category | Sea ice thickness |
|---|---|
| c1 | <1m |
| c2 | 1 - 1.5m |
| c3 | 1.5 - 2m |
| c4 | 2 - 2.5m |
| c5 | 2.5 - 3m |
| c6 | >3m |
Best estimate vs. observations
Contingency table
| observations | |||||||||
|---|---|---|---|---|---|---|---|---|---|
| open | c1 | c2 | c3 | c4 | c5 | c6 | |||
| m o d e l |
open | 0 | 0 | 0 | 0 | 0 | 0 | 0 | |
| c1 | 0 | 0.039 | 0.249 | 0.102 | 0.017 | 0.003 | 0.001 | ||
| c2 | 0 | 0.001 | 0.077 | 0.112 | 0.035 | 0.005 | 0.001 | ||
| c3 | 0 | 0 | 0.015 | 0.083 | 0.077 | 0.017 | 0.004 | ||
| c4 | 0 | 0 | 0.004 | 0.043 | 0.093 | 0.015 | 0.004 | ||
| c5 | 0 | 0 | 0 | 0 | 0.002 | 0.001 | 0 | ||
| c6 | 0 | 0 | 0 | 0 | 0 | 0 | 0 | ||
See category definitions for details.
Statistical distribution
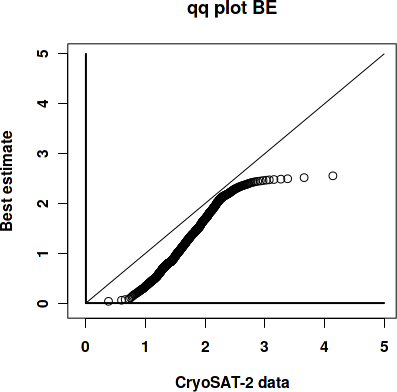
|
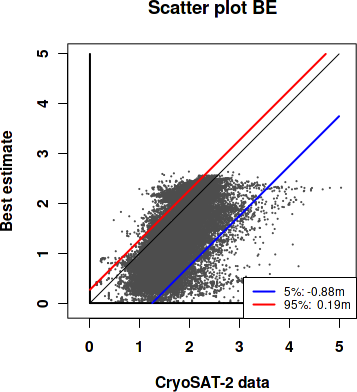
|
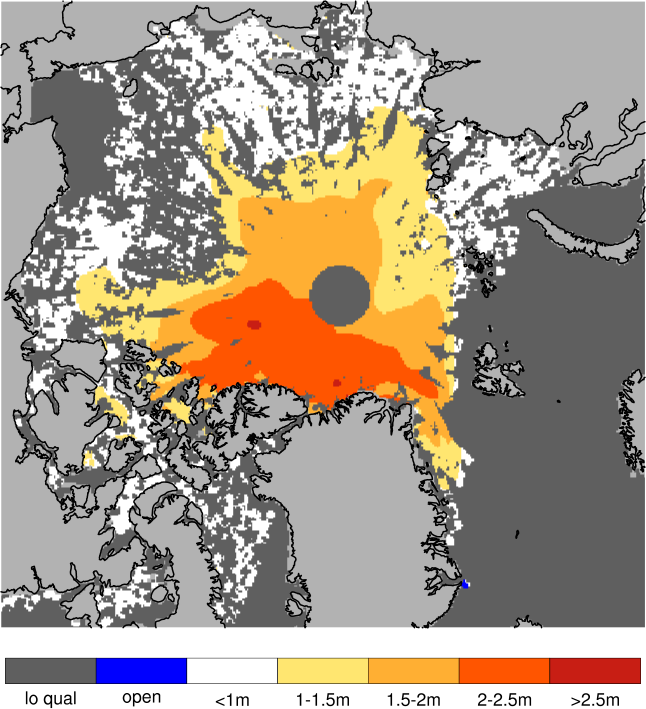
Observed sea ice thickness from CryoSAT
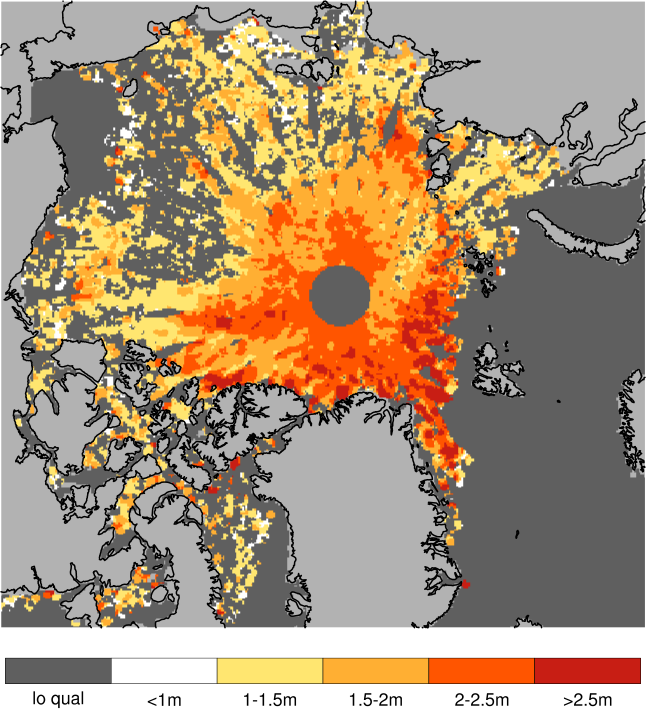
Sea ice thickness, best estimate product

Day 1 forecast vs. observations
Contingency table
| observations | |||||||||
|---|---|---|---|---|---|---|---|---|---|
| open | c1 | c2 | c3 | c4 | c5 | c6 | |||
| m o d e l |
open | 0 | 0 | 0 | 0 | 0 | 0 | 0 | |
| c1 | 0 | 0.039 | 0.248 | 0.101 | 0.017 | 0.003 | 0.001 | ||
| c2 | 0 | 0.001 | 0.078 | 0.11 | 0.037 | 0.006 | 0.001 | ||
| c3 | 0 | 0 | 0.016 | 0.088 | 0.078 | 0.016 | 0.004 | ||
| c4 | 0 | 0 | 0.004 | 0.04 | 0.091 | 0.015 | 0.004 | ||
| c5 | 0 | 0 | 0 | 0 | 0.001 | 0 | 0 | ||
| c6 | 0 | 0 | 0 | 0 | 0 | 0 | 0 | ||
See category definitions for details.
Statistical distribution
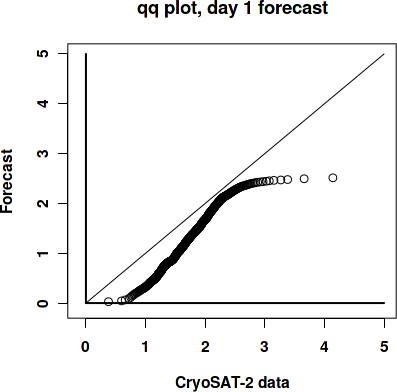
|
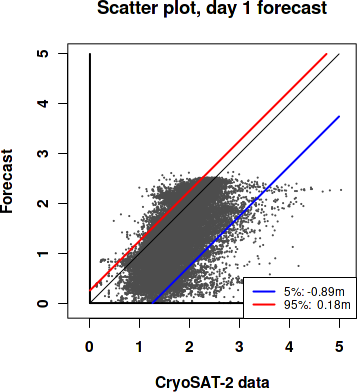
|
Sea ice thickness, day 1 forecast
Day 7 forecast vs. observations
Contingency table
| observations | |||||||||
|---|---|---|---|---|---|---|---|---|---|
| open | c1 | c2 | c3 | c4 | c5 | c6 | |||
| m o d e l |
open | 0 | 0 | 0 | 0 | 0 | 0 | 0 | |
| c1 | 0 | 0.038 | 0.243 | 0.097 | 0.015 | 0.003 | 0.001 | ||
| c2 | 0 | 0.002 | 0.083 | 0.111 | 0.039 | 0.007 | 0.001 | ||
| c3 | 0 | 0 | 0.015 | 0.091 | 0.077 | 0.016 | 0.004 | ||
| c4 | 0 | 0 | 0.004 | 0.039 | 0.091 | 0.015 | 0.004 | ||
| c5 | 0 | 0 | 0 | 0 | 0.002 | 0.001 | 0 | ||
| c6 | 0 | 0 | 0 | 0 | 0 | 0 | 0 | ||
See category definitions for details.
Statistical distribution
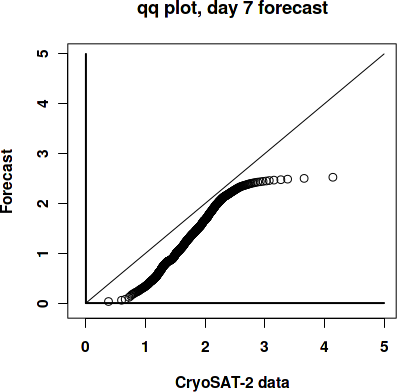
|
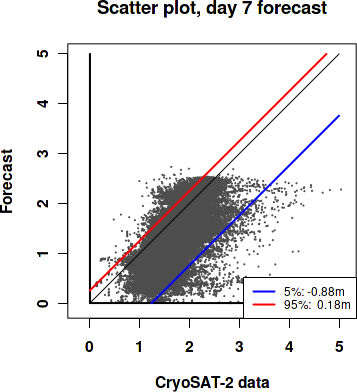
|
Sea ice thickness, day 7 forecast

Generated by /metno/routine/sms/V2/SIthickness/c2iceWebPage.sh Fri 23 Dec 2022 02:10:11 AM UTC on arcval