Validation of ice thickness - Full domain
Bulletin date: 2022-03-10
Model: ARC MFC - TOPAZ
Data source: UCL CryoSAT-2 sea ice thickness
Validation statistics summary
| Bias (m) | RMS (m) | total grids | low SIT | OK SIT | high SIT | |
|---|---|---|---|---|---|---|
| Best estimate | -0.45 | 0.73 | 52270 | 8315 | 43865 | 90 |
| Day 1 forecast | -0.46 | 0.74 | 52270 | 8500 | 43676 | 94 |
| Day 4 forecast | -0.47 | 0.75 | 52270 | 8646 | 43538 | 86 |
| Day 7 forecast | -0.46 | 0.74 | 52270 | 8355 | 43805 | 110 |
| Day 10 forecast | -0.51 | 0.78 | 52270 | 9361 | 42801 | 108 |
Numbers in the three rightmost columns are grid counts. Regions with high/low sea ice thickness correspond to areas with model offsets from the gridded observations outside of one standard deviation. (Standard deviations are provided in the observational product.)
Definition of categories:
| Category | Sea ice thickness |
|---|---|
| c1 | <1m |
| c2 | 1 - 1.5m |
| c3 | 1.5 - 2m |
| c4 | 2 - 2.5m |
| c5 | 2.5 - 3m |
| c6 | >3m |
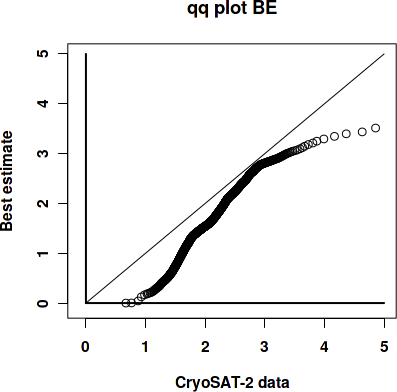
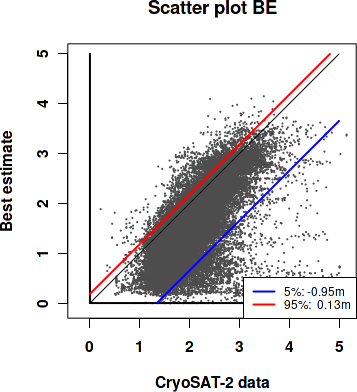
Best estimate vs. observations
Contingency table
| observations | |||||||||
|---|---|---|---|---|---|---|---|---|---|
| open | c1 | c2 | c3 | c4 | c5 | c6 | |||
| m o d e l |
open | 0 | 0 | 0 | 0.001 | 0.001 | 0 | 0 | |
| c1 | 0 | 0.004 | 0.052 | 0.074 | 0.023 | 0.008 | 0.007 | ||
| c2 | 0 | 0.001 | 0.039 | 0.151 | 0.045 | 0.006 | 0.002 | ||
| c3 | 0 | 0 | 0.005 | 0.106 | 0.123 | 0.014 | 0.002 | ||
| c4 | 0 | 0 | 0 | 0.013 | 0.096 | 0.067 | 0.007 | ||
| c5 | 0 | 0 | 0 | 0.002 | 0.017 | 0.085 | 0.032 | ||
| c6 | 0 | 0 | 0 | 0 | 0.001 | 0.005 | 0.012 | ||
See category definitions for details.
Statistical distribution
|
|
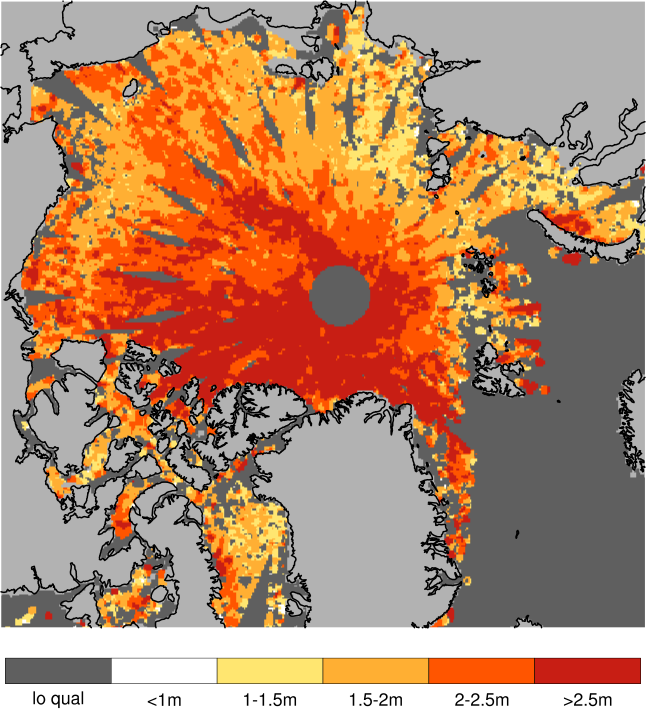
Observed sea ice thickness from CryoSAT
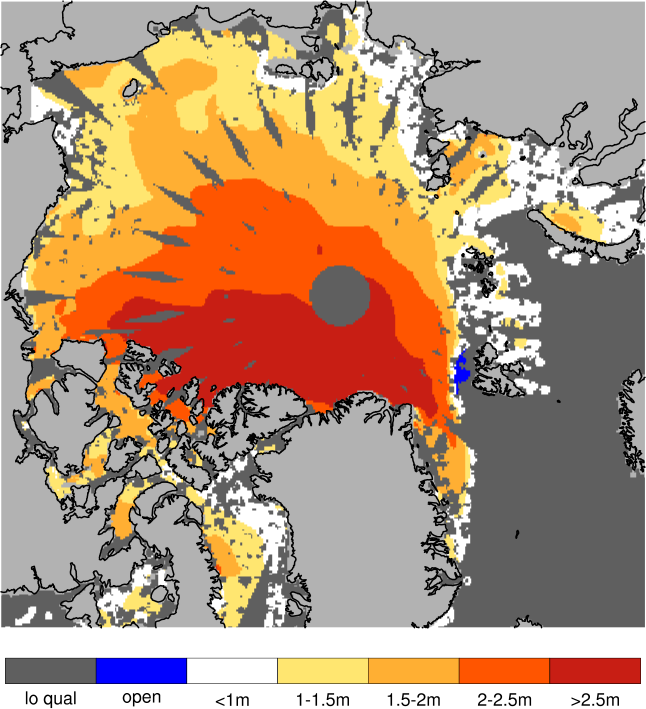
Sea ice thickness, best estimate product
Day 1 forecast vs. observations
Contingency table
| observations | |||||||||
|---|---|---|---|---|---|---|---|---|---|
| open | c1 | c2 | c3 | c4 | c5 | c6 | |||
| m o d e l |
open | 0 | 0 | 0 | 0.001 | 0.001 | 0 | 0 | |
| c1 | 0 | 0.004 | 0.052 | 0.074 | 0.024 | 0.008 | 0.007 | ||
| c2 | 0 | 0.001 | 0.04 | 0.165 | 0.055 | 0.006 | 0.002 | ||
| c3 | 0 | 0 | 0.004 | 0.093 | 0.117 | 0.015 | 0.002 | ||
| c4 | 0 | 0 | 0 | 0.011 | 0.091 | 0.068 | 0.008 | ||
| c5 | 0 | 0 | 0 | 0.002 | 0.016 | 0.082 | 0.03 | ||
| c6 | 0 | 0 | 0 | 0 | 0.001 | 0.005 | 0.013 | ||
See category definitions for details.
Statistical distribution
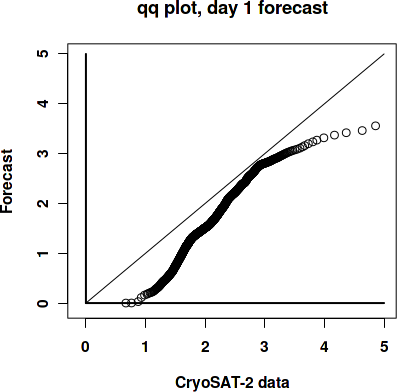
|
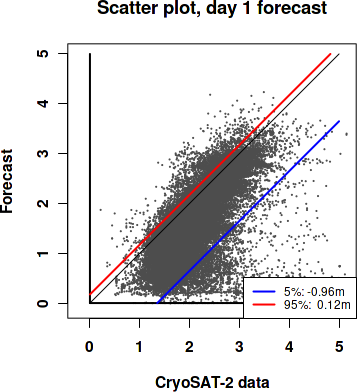
|
Sea ice thickness, day 1 forecast

Day 7 forecast vs. observations
Contingency table
| observations | |||||||||
|---|---|---|---|---|---|---|---|---|---|
| open | c1 | c2 | c3 | c4 | c5 | c6 | |||
| m o d e l |
open | 0 | 0 | 0 | 0.001 | 0.001 | 0 | 0 | |
| c1 | 0 | 0.004 | 0.05 | 0.072 | 0.023 | 0.008 | 0.007 | ||
| c2 | 0 | 0.001 | 0.041 | 0.169 | 0.057 | 0.007 | 0.002 | ||
| c3 | 0 | 0 | 0.005 | 0.091 | 0.118 | 0.014 | 0.002 | ||
| c4 | 0 | 0 | 0 | 0.011 | 0.089 | 0.068 | 0.008 | ||
| c5 | 0 | 0 | 0 | 0.002 | 0.016 | 0.079 | 0.027 | ||
| c6 | 0 | 0 | 0 | 0 | 0.001 | 0.007 | 0.016 | ||
See category definitions for details.
Statistical distribution
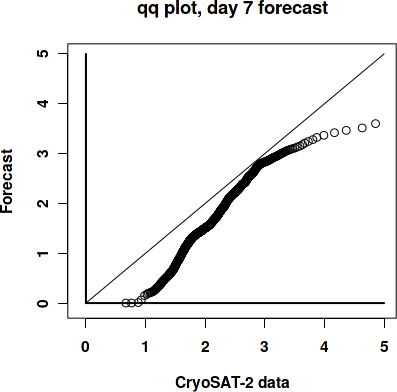
|
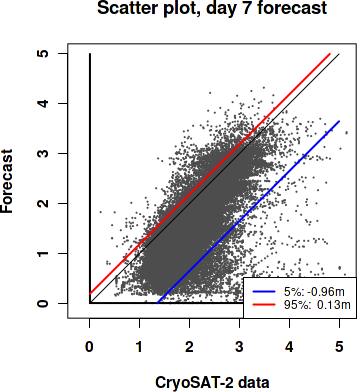
|
Sea ice thickness, day 7 forecast

Generated by /metno/routine/sms/V2/SIthickness/c2iceWebPage.sh Fri 25 Mar 2022 02:11:22 AM UTC on arcval