Validation of ice thickness - Full domain
Bulletin date: 2022-02-03
Model: ARC MFC - TOPAZ
Data source: UCL CryoSAT-2 sea ice thickness
Validation statistics summary
| Bias (m) | RMS (m) | total grids | low SIT | OK SIT | high SIT | |
|---|---|---|---|---|---|---|
| Best estimate | -0.38 | 0.67 | 47860 | 6657 | 41093 | 110 |
| Day 1 forecast | -0.39 | 0.67 | 47860 | 6524 | 41216 | 120 |
| Day 4 forecast | -0.39 | 0.67 | 47860 | 6555 | 41192 | 113 |
| Day 7 forecast | -0.38 | 0.67 | 47860 | 6401 | 41316 | 143 |
| Day 10 forecast | -0.39 | 0.68 | 47860 | 6634 | 41081 | 145 |
Numbers in the three rightmost columns are grid counts. Regions with high/low sea ice thickness correspond to areas with model offsets from the gridded observations outside of one standard deviation. (Standard deviations are provided in the observational product.)
Definition of categories:
| Category | Sea ice thickness |
|---|---|
| c1 | <1m |
| c2 | 1 - 1.5m |
| c3 | 1.5 - 2m |
| c4 | 2 - 2.5m |
| c5 | 2.5 - 3m |
| c6 | >3m |
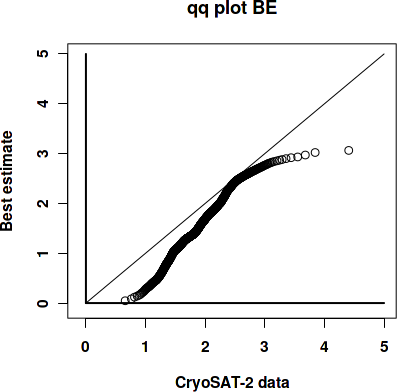
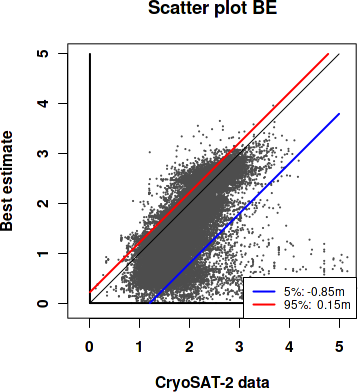
Best estimate vs. observations
Contingency table
| observations | |||||||||
|---|---|---|---|---|---|---|---|---|---|
| open | c1 | c2 | c3 | c4 | c5 | c6 | |||
| m o d e l |
open | 0 | 0 | 0 | 0 | 0 | 0 | 0 | |
| c1 | 0 | 0.009 | 0.086 | 0.077 | 0.015 | 0.005 | 0.006 | ||
| c2 | 0 | 0.003 | 0.127 | 0.205 | 0.028 | 0.003 | 0.001 | ||
| c3 | 0 | 0 | 0.008 | 0.111 | 0.091 | 0.007 | 0.001 | ||
| c4 | 0 | 0 | 0.001 | 0.016 | 0.087 | 0.026 | 0.002 | ||
| c5 | 0 | 0 | 0 | 0.003 | 0.025 | 0.046 | 0.009 | ||
| c6 | 0 | 0 | 0 | 0 | 0 | 0.001 | 0.002 | ||
See category definitions for details.
Statistical distribution
|
|
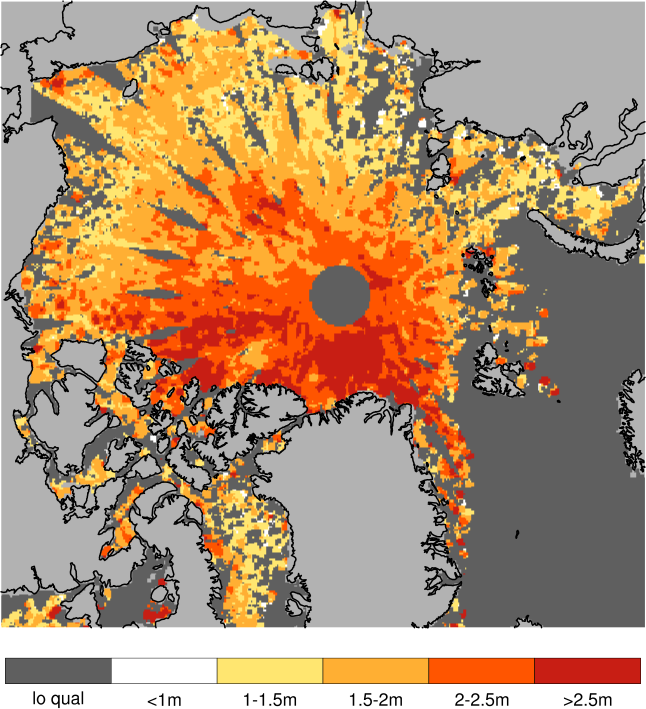
Observed sea ice thickness from CryoSAT
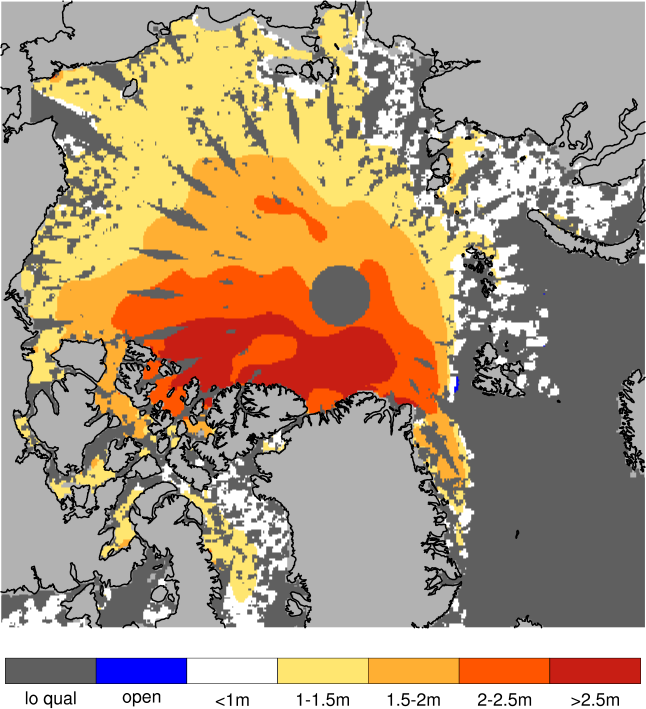
Sea ice thickness, best estimate product
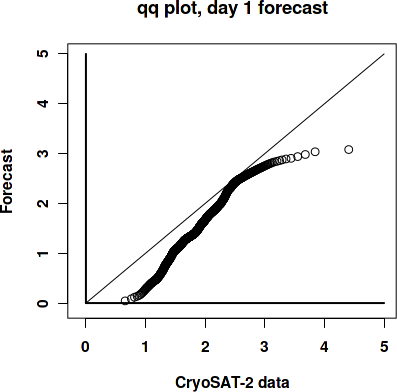
Day 1 forecast vs. observations
Contingency table
| observations | |||||||||
|---|---|---|---|---|---|---|---|---|---|
| open | c1 | c2 | c3 | c4 | c5 | c6 | |||
| m o d e l |
open | 0 | 0 | 0 | 0 | 0 | 0 | 0 | |
| c1 | 0 | 0.009 | 0.086 | 0.076 | 0.015 | 0.004 | 0.006 | ||
| c2 | 0 | 0.003 | 0.127 | 0.209 | 0.028 | 0.003 | 0.001 | ||
| c3 | 0 | 0 | 0.008 | 0.108 | 0.097 | 0.009 | 0.001 | ||
| c4 | 0 | 0 | 0.001 | 0.015 | 0.082 | 0.026 | 0.002 | ||
| c5 | 0 | 0 | 0 | 0.003 | 0.023 | 0.044 | 0.009 | ||
| c6 | 0 | 0 | 0 | 0 | 0 | 0.001 | 0.002 | ||
See category definitions for details.
Statistical distribution
|

|
Sea ice thickness, day 1 forecast

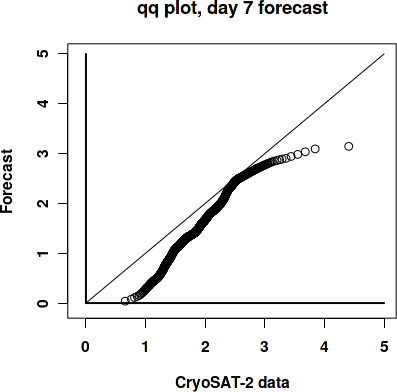
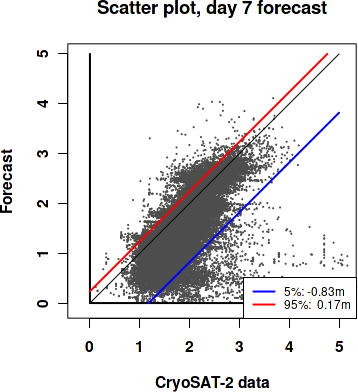
Day 7 forecast vs. observations
Contingency table
| observations | |||||||||
|---|---|---|---|---|---|---|---|---|---|
| open | c1 | c2 | c3 | c4 | c5 | c6 | |||
| m o d e l |
open | 0 | 0 | 0 | 0 | 0 | 0 | 0 | |
| c1 | 0 | 0.009 | 0.085 | 0.076 | 0.015 | 0.004 | 0.006 | ||
| c2 | 0 | 0.003 | 0.127 | 0.208 | 0.029 | 0.003 | 0.001 | ||
| c3 | 0 | 0 | 0.009 | 0.108 | 0.098 | 0.01 | 0.001 | ||
| c4 | 0 | 0 | 0.001 | 0.014 | 0.077 | 0.024 | 0.001 | ||
| c5 | 0 | 0 | 0 | 0.004 | 0.027 | 0.045 | 0.009 | ||
| c6 | 0 | 0 | 0 | 0 | 0 | 0.002 | 0.002 | ||
See category definitions for details.
Statistical distribution
|
|
Sea ice thickness, day 7 forecast

Generated by /metno/routine/sms/V2/SIthickness/c2iceWebPage.sh ma. 07. mars 08:07:48 +0000 2022 on arcval