Validation of ice thickness - Full domain
Bulletin date: 2022-01-06
Model: ARC MFC - TOPAZ
Data source: UCL CryoSAT-2 sea ice thickness
Validation statistics summary
| Bias (m) | RMS (m) | total grids | low SIT | OK SIT | high SIT | |
|---|---|---|---|---|---|---|
| Best estimate | -0.38 | 0.62 | 45219 | 6836 | 38302 | 81 |
| Day 1 forecast | -0.38 | 0.63 | 45219 | 6977 | 38166 | 76 |
| Day 4 forecast | -0.39 | 0.63 | 45219 | 7147 | 37996 | 76 |
| Day 7 forecast | -0.37 | 0.62 | 45219 | 6777 | 38335 | 107 |
| Day 10 forecast | -0.39 | 0.64 | 45219 | 7501 | 37622 | 96 |
Numbers in the three rightmost columns are grid counts. Regions with high/low sea ice thickness correspond to areas with model offsets from the gridded observations outside of one standard deviation. (Standard deviations are provided in the observational product.)
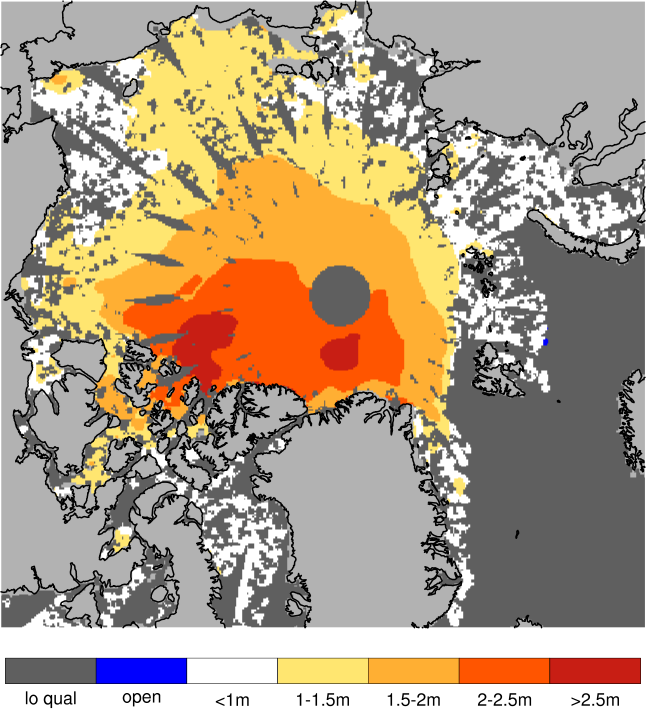
Definition of categories:
| Category | Sea ice thickness |
|---|---|
| c1 | <1m |
| c2 | 1 - 1.5m |
| c3 | 1.5 - 2m |
| c4 | 2 - 2.5m |
| c5 | 2.5 - 3m |
| c6 | >3m |
Best estimate vs. observations
Contingency table
| observations | |||||||||
|---|---|---|---|---|---|---|---|---|---|
| open | c1 | c2 | c3 | c4 | c5 | c6 | |||
| m o d e l |
open | 0 | 0 | 0 | 0 | 0 | 0 | 0 | |
| c1 | 0 | 0.023 | 0.167 | 0.09 | 0.013 | 0.004 | 0.003 | ||
| c2 | 0 | 0.003 | 0.125 | 0.153 | 0.019 | 0.002 | 0 | ||
| c3 | 0 | 0 | 0.012 | 0.122 | 0.077 | 0.005 | 0 | ||
| c4 | 0 | 0 | 0.001 | 0.031 | 0.095 | 0.019 | 0.001 | ||
| c5 | 0 | 0 | 0 | 0 | 0.009 | 0.019 | 0.003 | ||
| c6 | 0 | 0 | 0 | 0 | 0 | 0 | 0 | ||
See category definitions for details.
Statistical distribution
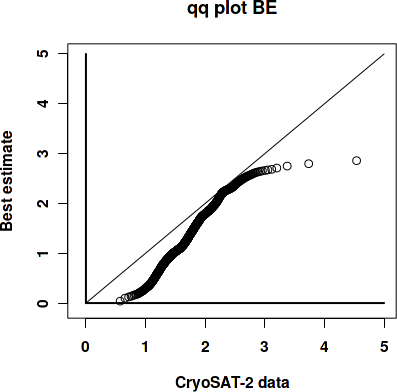
|
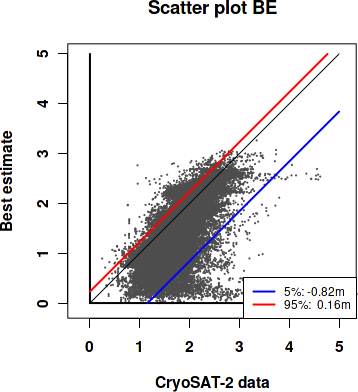
|
Observed sea ice thickness from CryoSAT
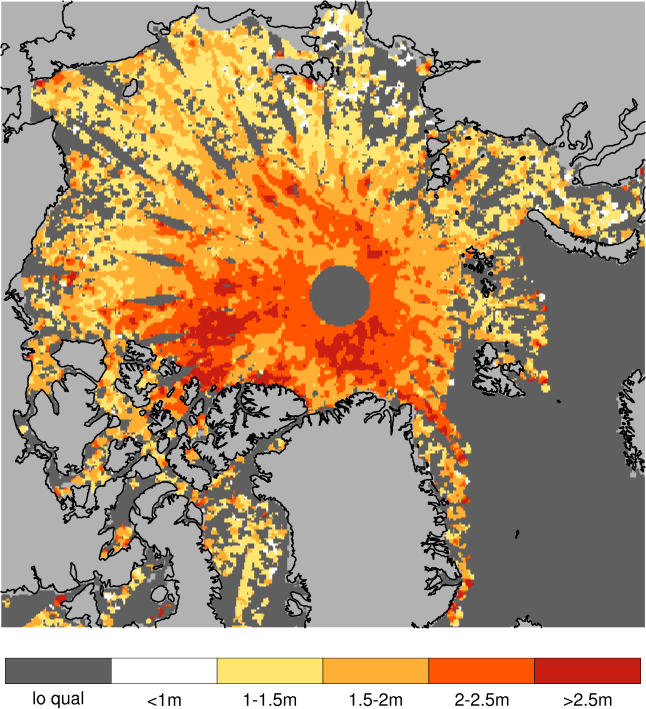
Sea ice thickness, best estimate product

Day 1 forecast vs. observations
Contingency table
| observations | |||||||||
|---|---|---|---|---|---|---|---|---|---|
| open | c1 | c2 | c3 | c4 | c5 | c6 | |||
| m o d e l |
open | 0 | 0 | 0 | 0 | 0 | 0 | 0 | |
| c1 | 0 | 0.023 | 0.165 | 0.092 | 0.014 | 0.004 | 0.003 | ||
| c2 | 0 | 0.004 | 0.127 | 0.15 | 0.019 | 0.002 | 0 | ||
| c3 | 0 | 0 | 0.013 | 0.124 | 0.079 | 0.006 | 0.001 | ||
| c4 | 0 | 0 | 0.001 | 0.03 | 0.093 | 0.019 | 0.001 | ||
| c5 | 0 | 0 | 0 | 0 | 0.009 | 0.018 | 0.003 | ||
| c6 | 0 | 0 | 0 | 0 | 0 | 0 | 0 | ||
See category definitions for details.
Statistical distribution
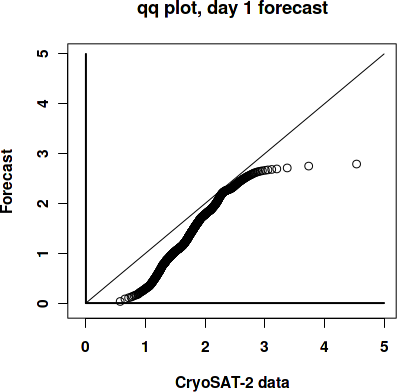
|

|
Sea ice thickness, day 1 forecast

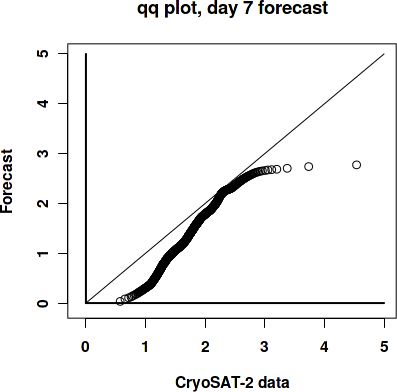
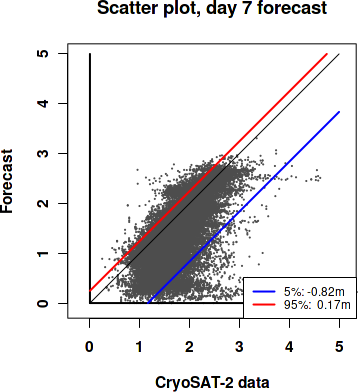
Day 7 forecast vs. observations
Contingency table
| observations | |||||||||
|---|---|---|---|---|---|---|---|---|---|
| open | c1 | c2 | c3 | c4 | c5 | c6 | |||
| m o d e l |
open | 0 | 0 | 0 | 0 | 0 | 0 | 0 | |
| c1 | 0 | 0.021 | 0.156 | 0.087 | 0.013 | 0.004 | 0.003 | ||
| c2 | 0 | 0.005 | 0.135 | 0.152 | 0.02 | 0.002 | 0 | ||
| c3 | 0 | 0 | 0.014 | 0.126 | 0.079 | 0.006 | 0 | ||
| c4 | 0 | 0 | 0.001 | 0.031 | 0.093 | 0.02 | 0.001 | ||
| c5 | 0 | 0 | 0 | 0 | 0.009 | 0.018 | 0.003 | ||
| c6 | 0 | 0 | 0 | 0 | 0 | 0 | 0 | ||
See category definitions for details.
Statistical distribution
|
|
Sea ice thickness, day 7 forecast
Generated by /metno/routine/sms/V2/SIthickness/c2iceWebPage.sh Fri 21 Jan 2022 02:13:03 AM UTC on arcval