Validation of ice thickness - Full domain
Bulletin date: 2021-12-30
Model: ARC MFC - TOPAZ
Data source: UCL CryoSAT-2 sea ice thickness
Validation statistics summary
| Bias (m) | RMS (m) | total grids | low SIT | OK SIT | high SIT | |
|---|---|---|---|---|---|---|
| Best estimate | -0.34 | 0.56 | 38437 | 5856 | 32498 | 83 |
| Day 1 forecast | -0.34 | 0.57 | 38437 | 5929 | 32410 | 98 |
| Day 4 forecast | -0.35 | 0.57 | 38437 | 6092 | 32250 | 95 |
| Day 7 forecast | -0.33 | 0.56 | 38437 | 5717 | 32602 | 118 |
| Day 10 forecast | -0.33 | 0.57 | 38437 | 5849 | 32477 | 111 |
Numbers in the three rightmost columns are grid counts. Regions with high/low sea ice thickness correspond to areas with model offsets from the gridded observations outside of one standard deviation. (Standard deviations are provided in the observational product.)
Definition of categories:
| Category | Sea ice thickness |
|---|---|
| c1 | <1m |
| c2 | 1 - 1.5m |
| c3 | 1.5 - 2m |
| c4 | 2 - 2.5m |
| c5 | 2.5 - 3m |
| c6 | >3m |
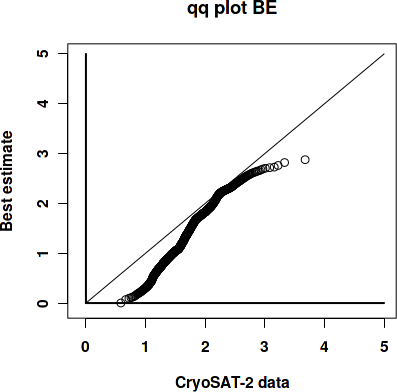
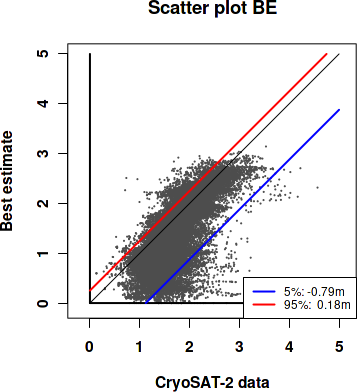
Best estimate vs. observations
Contingency table
| observations | |||||||||
|---|---|---|---|---|---|---|---|---|---|
| open | c1 | c2 | c3 | c4 | c5 | c6 | |||
| m o d e l |
open | 0 | 0 | 0 | 0.001 | 0 | 0 | 0 | |
| c1 | 0 | 0.027 | 0.195 | 0.087 | 0.011 | 0.002 | 0.001 | ||
| c2 | 0 | 0.005 | 0.114 | 0.122 | 0.013 | 0.001 | 0 | ||
| c3 | 0 | 0 | 0.018 | 0.146 | 0.069 | 0.003 | 0 | ||
| c4 | 0 | 0 | 0.001 | 0.03 | 0.096 | 0.023 | 0.002 | ||
| c5 | 0 | 0 | 0 | 0.001 | 0.009 | 0.018 | 0.005 | ||
| c6 | 0 | 0 | 0 | 0 | 0 | 0 | 0 | ||
See category definitions for details.
Statistical distribution
|
|
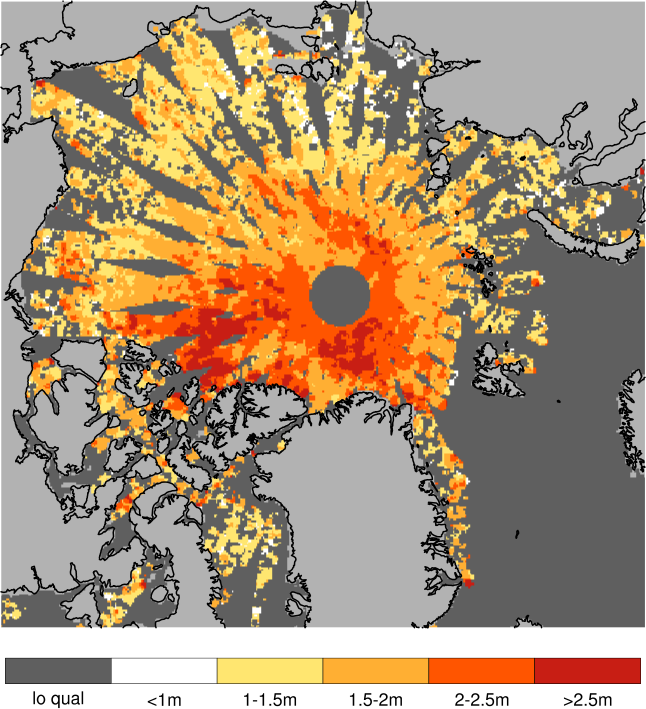
Observed sea ice thickness from CryoSAT
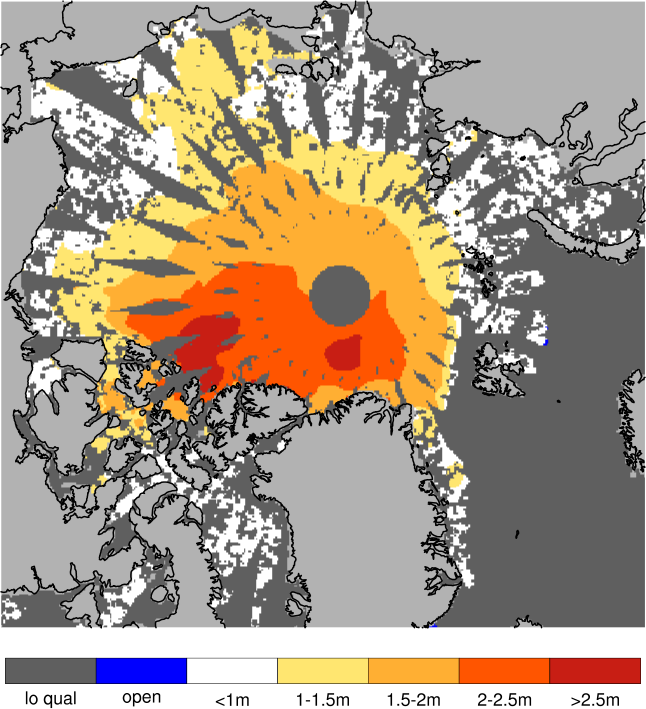
Sea ice thickness, best estimate product
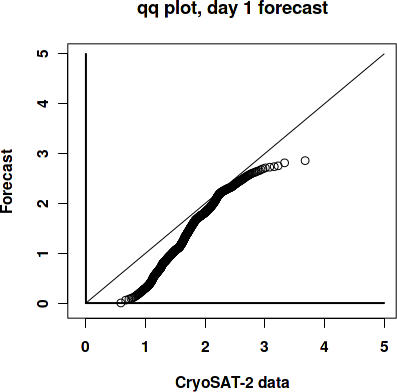
Day 1 forecast vs. observations
Contingency table
| observations | |||||||||
|---|---|---|---|---|---|---|---|---|---|
| open | c1 | c2 | c3 | c4 | c5 | c6 | |||
| m o d e l |
open | 0 | 0 | 0 | 0.001 | 0 | 0 | 0 | |
| c1 | 0 | 0.026 | 0.189 | 0.086 | 0.011 | 0.002 | 0.001 | ||
| c2 | 0 | 0.005 | 0.119 | 0.121 | 0.013 | 0.001 | 0 | ||
| c3 | 0 | 0 | 0.019 | 0.147 | 0.072 | 0.003 | 0 | ||
| c4 | 0 | 0 | 0.001 | 0.031 | 0.094 | 0.024 | 0.002 | ||
| c5 | 0 | 0 | 0 | 0.001 | 0.009 | 0.017 | 0.005 | ||
| c6 | 0 | 0 | 0 | 0 | 0 | 0 | 0 | ||
See category definitions for details.
Statistical distribution
|

|
Sea ice thickness, day 1 forecast

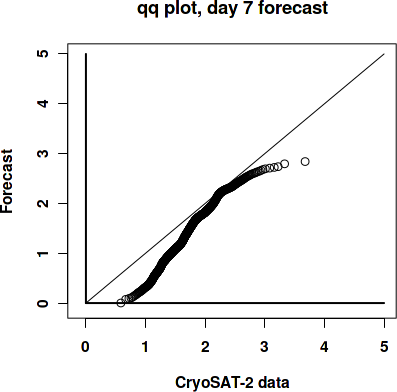
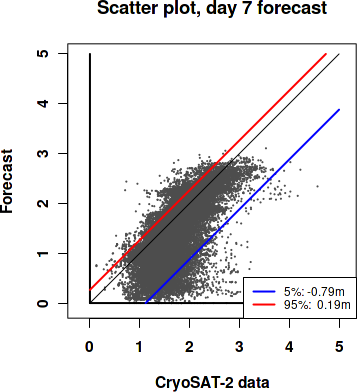
Day 7 forecast vs. observations
Contingency table
| observations | |||||||||
|---|---|---|---|---|---|---|---|---|---|
| open | c1 | c2 | c3 | c4 | c5 | c6 | |||
| m o d e l |
open | 0 | 0 | 0 | 0.001 | 0 | 0 | 0 | |
| c1 | 0 | 0.025 | 0.176 | 0.082 | 0.01 | 0.002 | 0.001 | ||
| c2 | 0 | 0.007 | 0.13 | 0.122 | 0.014 | 0.001 | 0 | ||
| c3 | 0 | 0 | 0.021 | 0.149 | 0.072 | 0.004 | 0 | ||
| c4 | 0 | 0 | 0.001 | 0.031 | 0.094 | 0.024 | 0.002 | ||
| c5 | 0 | 0 | 0 | 0.001 | 0.008 | 0.017 | 0.005 | ||
| c6 | 0 | 0 | 0 | 0 | 0 | 0 | 0 | ||
See category definitions for details.
Statistical distribution
|
|
Sea ice thickness, day 7 forecast

Generated by /metno/routine/sms/V2/SIthickness/c2iceWebPage.sh Fri 14 Jan 2022 02:15:07 AM UTC on arcval