Validation of ice thickness - Full domain
Bulletin date: 2021-12-16
Model: ARC MFC - TOPAZ
Data source: UCL CryoSAT-2 sea ice thickness
Validation statistics summary
| Bias (m) | RMS (m) | total grids | low SIT | OK SIT | high SIT | |
|---|---|---|---|---|---|---|
| Best estimate | -0.33 | 0.59 | 38852 | 5938 | 32805 | 109 |
| Day 1 forecast | -0.33 | 0.59 | 38852 | 5906 | 32844 | 102 |
| Day 4 forecast | -0.33 | 0.6 | 38852 | 6072 | 32682 | 98 |
| Day 7 forecast | -0.31 | 0.59 | 38852 | 5569 | 33170 | 113 |
| Day 10 forecast | -0.33 | 0.61 | 38852 | 6335 | 32415 | 102 |
Numbers in the three rightmost columns are grid counts. Regions with high/low sea ice thickness correspond to areas with model offsets from the gridded observations outside of one standard deviation. (Standard deviations are provided in the observational product.)
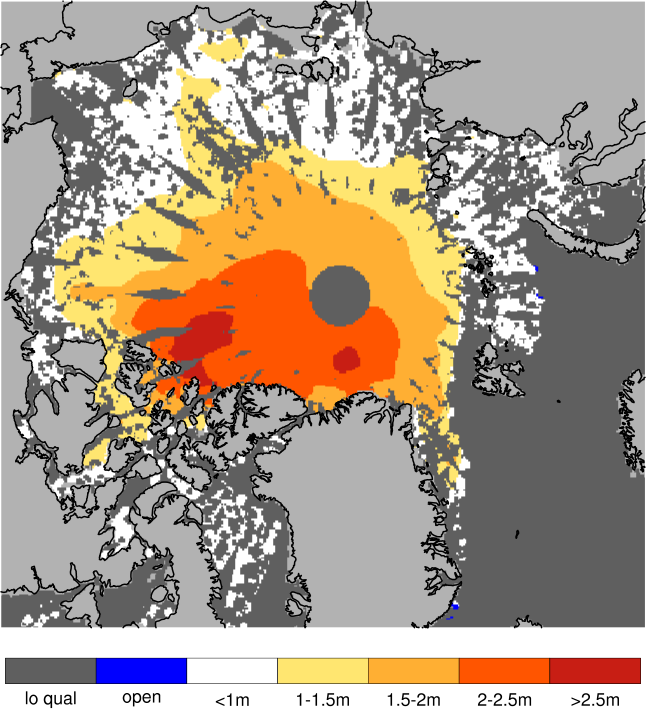
Definition of categories:
| Category | Sea ice thickness |
|---|---|
| c1 | <1m |
| c2 | 1 - 1.5m |
| c3 | 1.5 - 2m |
| c4 | 2 - 2.5m |
| c5 | 2.5 - 3m |
| c6 | >3m |
Best estimate vs. observations
Contingency table
| observations | |||||||||
|---|---|---|---|---|---|---|---|---|---|
| open | c1 | c2 | c3 | c4 | c5 | c6 | |||
| m o d e l |
open | 0 | 0 | 0 | 0 | 0 | 0 | 0.001 | |
| c1 | 0 | 0.039 | 0.226 | 0.074 | 0.012 | 0.003 | 0.004 | ||
| c2 | 0 | 0.001 | 0.088 | 0.109 | 0.012 | 0.002 | 0.001 | ||
| c3 | 0 | 0 | 0.016 | 0.138 | 0.072 | 0.004 | 0 | ||
| c4 | 0 | 0 | 0.002 | 0.051 | 0.098 | 0.018 | 0.001 | ||
| c5 | 0 | 0 | 0 | 0.001 | 0.012 | 0.015 | 0.001 | ||
| c6 | 0 | 0 | 0 | 0 | 0 | 0 | 0 | ||
See category definitions for details.
Statistical distribution
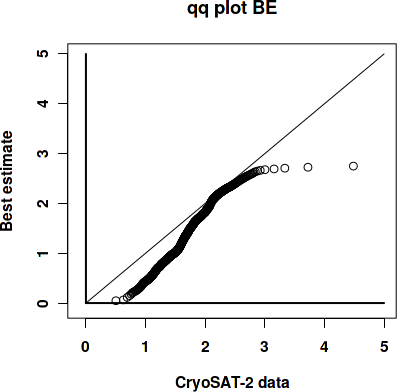
|
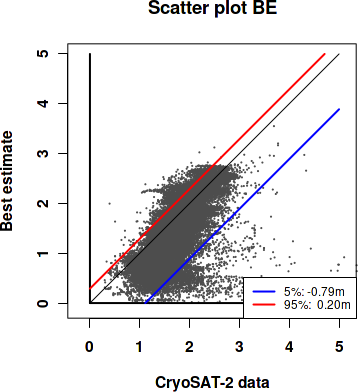
|
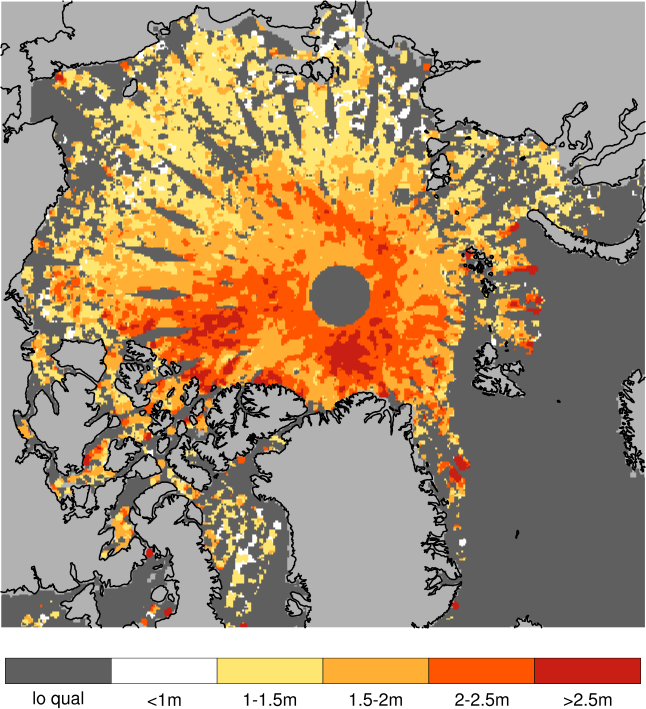
Observed sea ice thickness from CryoSAT
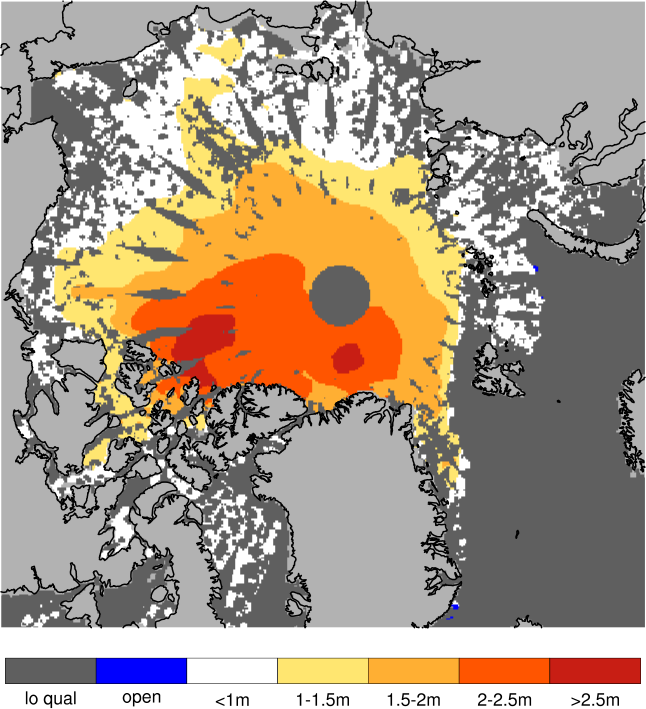
Sea ice thickness, best estimate product
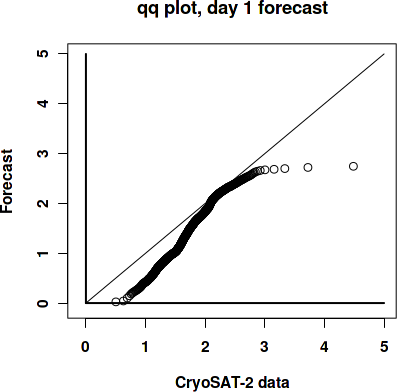
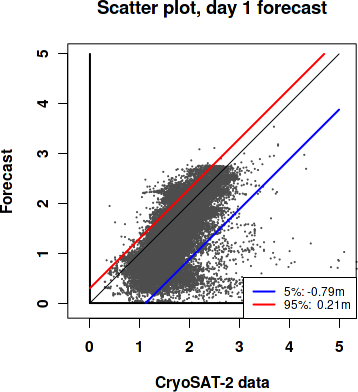
Day 1 forecast vs. observations
Contingency table
| observations | |||||||||
|---|---|---|---|---|---|---|---|---|---|
| open | c1 | c2 | c3 | c4 | c5 | c6 | |||
| m o d e l |
open | 0 | 0 | 0 | 0 | 0 | 0 | 0.001 | |
| c1 | 0 | 0.039 | 0.221 | 0.072 | 0.011 | 0.003 | 0.003 | ||
| c2 | 0 | 0.001 | 0.092 | 0.111 | 0.013 | 0.002 | 0.001 | ||
| c3 | 0 | 0 | 0.018 | 0.136 | 0.071 | 0.004 | 0 | ||
| c4 | 0 | 0 | 0.002 | 0.053 | 0.098 | 0.02 | 0.001 | ||
| c5 | 0 | 0 | 0 | 0.001 | 0.011 | 0.013 | 0.001 | ||
| c6 | 0 | 0 | 0 | 0 | 0 | 0 | 0 | ||
See category definitions for details.
Statistical distribution
|
|
Sea ice thickness, day 1 forecast
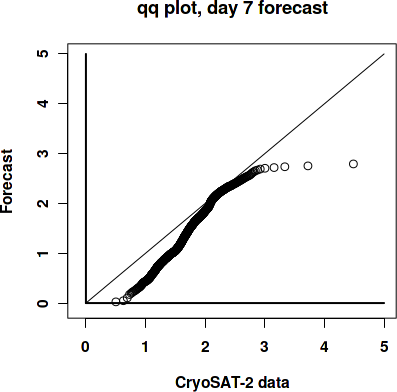
Day 7 forecast vs. observations
Contingency table
| observations | |||||||||
|---|---|---|---|---|---|---|---|---|---|
| open | c1 | c2 | c3 | c4 | c5 | c6 | |||
| m o d e l |
open | 0 | 0 | 0 | 0 | 0 | 0 | 0.001 | |
| c1 | 0 | 0.039 | 0.203 | 0.068 | 0.011 | 0.003 | 0.003 | ||
| c2 | 0 | 0.002 | 0.108 | 0.113 | 0.014 | 0.002 | 0.001 | ||
| c3 | 0 | 0 | 0.019 | 0.136 | 0.071 | 0.004 | 0 | ||
| c4 | 0 | 0 | 0.002 | 0.056 | 0.096 | 0.02 | 0 | ||
| c5 | 0 | 0 | 0 | 0.001 | 0.013 | 0.013 | 0 | ||
| c6 | 0 | 0 | 0 | 0 | 0 | 0 | 0 | ||
See category definitions for details.
Statistical distribution
|

|
Sea ice thickness, day 7 forecast

Generated by /metno/routine/sms/V2/SIthickness/c2iceWebPage.sh Fri 31 Dec 2021 02:25:41 AM UTC on arcval