Validation of ice thickness - Full domain
Bulletin date: 2021-12-02
Model: ARC MFC - TOPAZ
Data source: UCL CryoSAT-2 sea ice thickness
Validation statistics summary
| Bias (m) | RMS (m) | total grids | low SIT | OK SIT | high SIT | |
|---|---|---|---|---|---|---|
| Best estimate | -0.28 | 0.59 | 37493 | 6776 | 30615 | 102 |
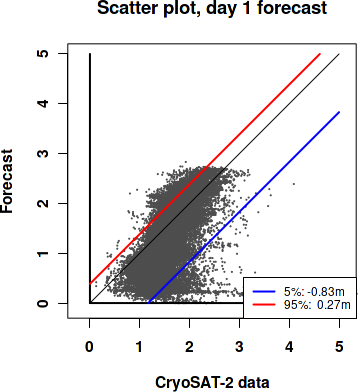
| Day 1 forecast | -0.28 | 0.59 | 37493 | 6879 | 30515 | 99 |
| Day 4 forecast | -0.29 | 0.6 | 37493 | 7149 | 30247 | 97 |
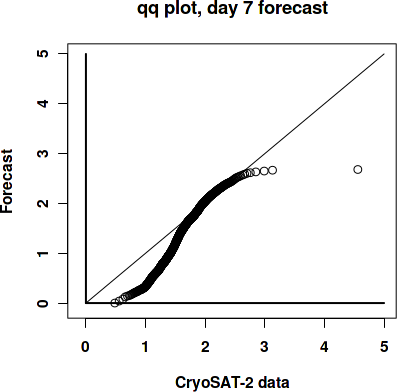
| Day 7 forecast | -0.27 | 0.58 | 37493 | 6545 | 30833 | 115 |
| Day 10 forecast | -0.33 | 0.62 | 37493 | 7953 | 29442 | 98 |
Numbers in the three rightmost columns are grid counts. Regions with high/low sea ice thickness correspond to areas with model offsets from the gridded observations outside of one standard deviation. (Standard deviations are provided in the observational product.)
Definition of categories:
| Category | Sea ice thickness |
|---|---|
| c1 | <1m |
| c2 | 1 - 1.5m |
| c3 | 1.5 - 2m |
| c4 | 2 - 2.5m |
| c5 | 2.5 - 3m |
| c6 | >3m |
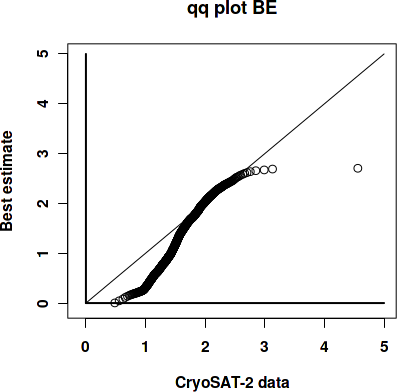
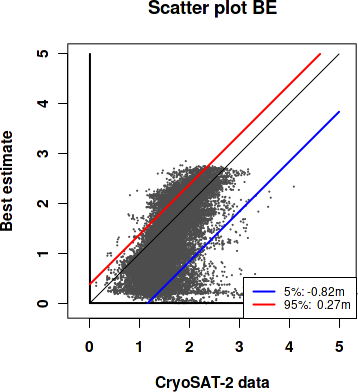
Best estimate vs. observations
Contingency table
| observations | |||||||||
|---|---|---|---|---|---|---|---|---|---|
| open | c1 | c2 | c3 | c4 | c5 | c6 | |||
| m o d e l |
open | 0 | 0 | 0 | 0.001 | 0.001 | 0 | 0 | |
| c1 | 0 | 0.061 | 0.24 | 0.066 | 0.01 | 0.002 | 0.003 | ||
| c2 | 0 | 0.001 | 0.106 | 0.082 | 0.007 | 0.001 | 0 | ||
| c3 | 0 | 0 | 0.035 | 0.167 | 0.032 | 0.002 | 0 | ||
| c4 | 0 | 0 | 0.005 | 0.065 | 0.089 | 0.006 | 0 | ||
| c5 | 0 | 0 | 0 | 0.002 | 0.012 | 0.004 | 0 | ||
| c6 | 0 | 0 | 0 | 0 | 0 | 0 | 0 | ||
See category definitions for details.
Statistical distribution
|
|
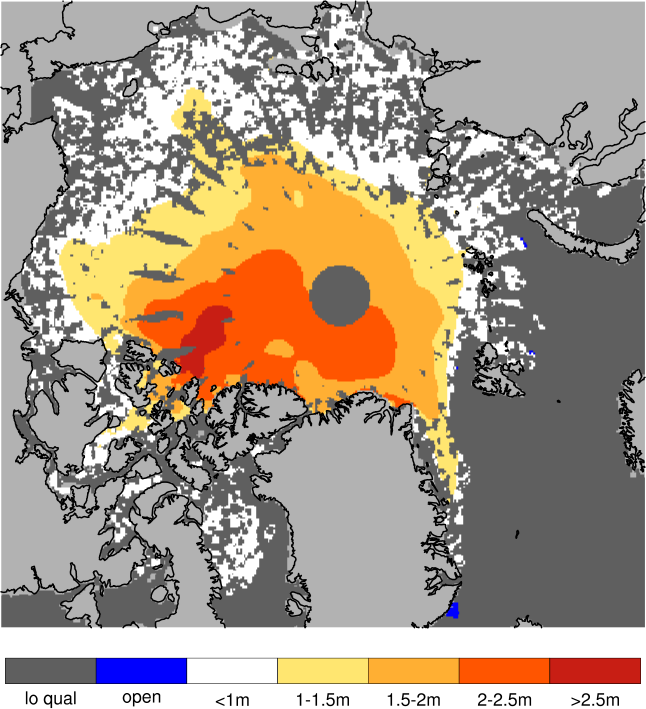
Observed sea ice thickness from CryoSAT
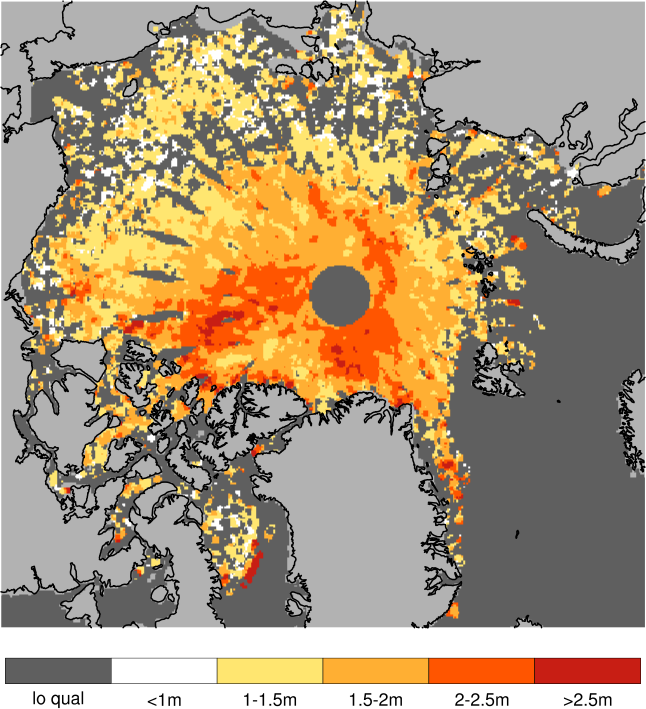
Sea ice thickness, best estimate product

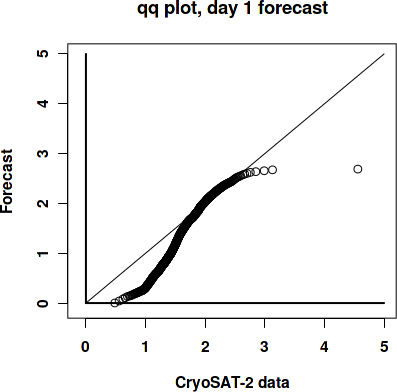
Day 1 forecast vs. observations
Contingency table
| observations | |||||||||
|---|---|---|---|---|---|---|---|---|---|
| open | c1 | c2 | c3 | c4 | c5 | c6 | |||
| m o d e l |
open | 0 | 0 | 0 | 0.001 | 0.001 | 0 | 0 | |
| c1 | 0 | 0.061 | 0.237 | 0.066 | 0.01 | 0.002 | 0.003 | ||
| c2 | 0 | 0.001 | 0.109 | 0.081 | 0.007 | 0.001 | 0 | ||
| c3 | 0 | 0 | 0.035 | 0.166 | 0.034 | 0.001 | 0 | ||
| c4 | 0 | 0 | 0.006 | 0.065 | 0.087 | 0.006 | 0 | ||
| c5 | 0 | 0 | 0 | 0.002 | 0.012 | 0.004 | 0 | ||
| c6 | 0 | 0 | 0 | 0 | 0 | 0 | 0 | ||
See category definitions for details.
Statistical distribution
|
|
Sea ice thickness, day 1 forecast
Day 7 forecast vs. observations
Contingency table
| observations | |||||||||
|---|---|---|---|---|---|---|---|---|---|
| open | c1 | c2 | c3 | c4 | c5 | c6 | |||
| m o d e l |
open | 0 | 0 | 0 | 0.001 | 0.001 | 0 | 0 | |
| c1 | 0 | 0.06 | 0.23 | 0.064 | 0.01 | 0.002 | 0.003 | ||
| c2 | 0 | 0.002 | 0.112 | 0.082 | 0.007 | 0.001 | 0 | ||
| c3 | 0 | 0 | 0.037 | 0.164 | 0.034 | 0.001 | 0 | ||
| c4 | 0 | 0 | 0.007 | 0.069 | 0.087 | 0.007 | 0 | ||
| c5 | 0 | 0 | 0 | 0.002 | 0.012 | 0.004 | 0 | ||
| c6 | 0 | 0 | 0 | 0 | 0 | 0 | 0 | ||
See category definitions for details.
Statistical distribution
|

|
Sea ice thickness, day 7 forecast

Generated by /metno/routine/sms/V2/SIthickness/c2iceWebPage.sh Fri 17 Dec 2021 02:17:11 AM UTC on arcval