Validation of ice thickness - Full domain
Bulletin date: 2021-05-20
Model: ARC MFC - TOPAZ
Data source: UCL CryoSAT-2 sea ice thickness
Validation statistics summary
| Bias (m) | RMS (m) | total grids | low SIT | OK SIT | high SIT | |
|---|---|---|---|---|---|---|
| Best estimate | -0.55 | 0.86 | 35438 | 4689 | 30603 | 146 |
| Day 1 forecast | -0.55 | 0.86 | 35438 | 4714 | 30586 | 138 |
| Day 4 forecast | -0.55 | 0.86 | 35438 | 4735 | 30567 | 136 |
| Day 7 forecast | -0.56 | 0.86 | 35438 | 4700 | 30595 | 143 |
| Day 10 forecast | -0.55 | 0.86 | 35438 | 4605 | 30690 | 143 |
Numbers in the three rightmost columns are grid counts. Regions with high/low sea ice thickness correspond to areas with model offsets from the gridded observations outside of one standard deviation. (Standard deviations are provided in the observational product.)
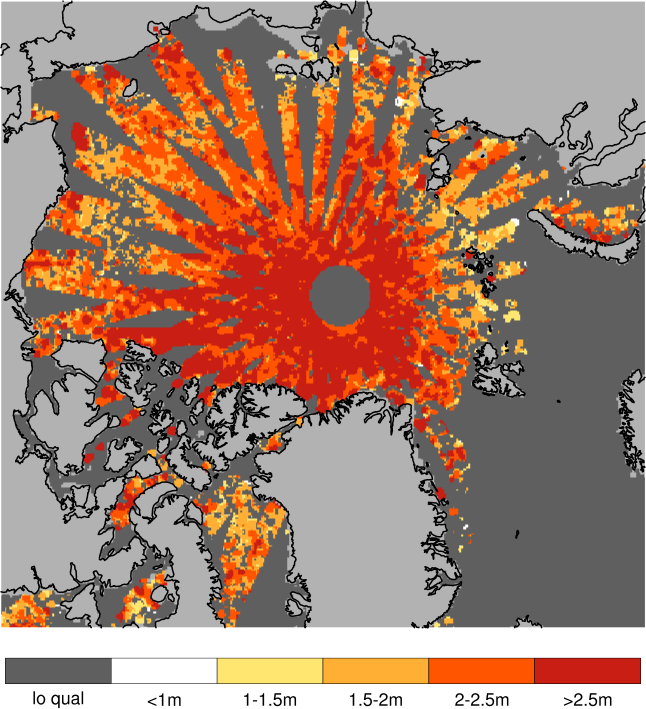
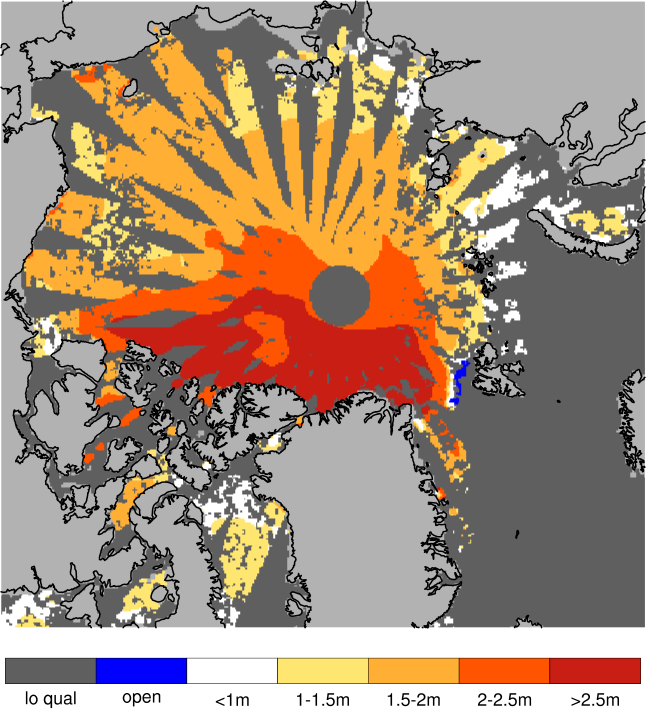
Definition of categories:
| Category | Sea ice thickness |
|---|---|
| c1 | <1m |
| c2 | 1 - 1.5m |
| c3 | 1.5 - 2m |
| c4 | 2 - 2.5m |
| c5 | 2.5 - 3m |
| c6 | >3m |
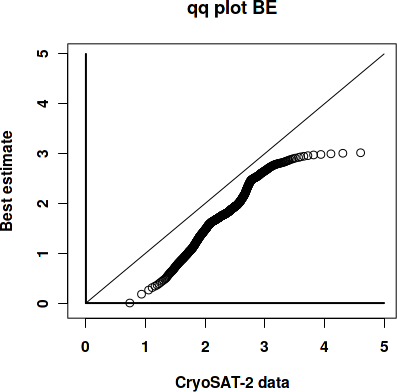
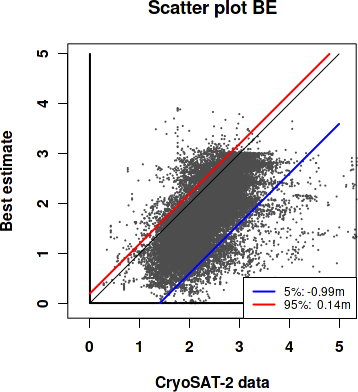
Best estimate vs. observations
Contingency table
| observations | |||||||||
|---|---|---|---|---|---|---|---|---|---|
| open | c1 | c2 | c3 | c4 | c5 | c6 | |||
| m o d e l |
open | 0 | 0 | 0 | 0 | 0.001 | 0 | 0 | |
| c1 | 0 | 0.002 | 0.018 | 0.045 | 0.024 | 0.006 | 0.003 | ||
| c2 | 0 | 0.001 | 0.014 | 0.081 | 0.062 | 0.012 | 0.007 | ||
| c3 | 0 | 0 | 0.004 | 0.087 | 0.197 | 0.089 | 0.013 | ||
| c4 | 0 | 0 | 0.001 | 0.006 | 0.044 | 0.09 | 0.025 | ||
| c5 | 0 | 0 | 0 | 0.003 | 0.029 | 0.087 | 0.038 | ||
| c6 | 0 | 0 | 0 | 0.001 | 0.002 | 0.003 | 0.002 | ||
See category definitions for details.
Statistical distribution
|
|
Observed sea ice thickness from CryoSAT
Sea ice thickness, best estimate product

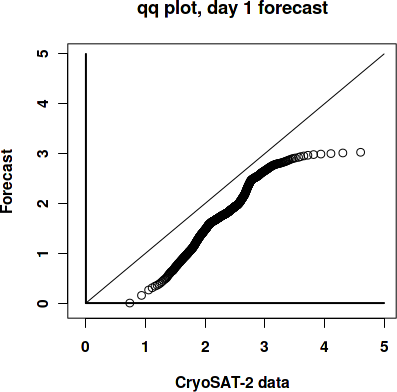
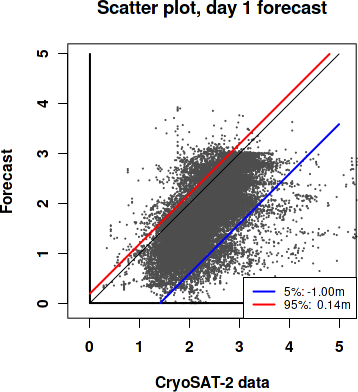
Day 1 forecast vs. observations
Contingency table
| observations | |||||||||
|---|---|---|---|---|---|---|---|---|---|
| open | c1 | c2 | c3 | c4 | c5 | c6 | |||
| m o d e l |
open | 0 | 0 | 0 | 0 | 0.001 | 0 | 0 | |
| c1 | 0 | 0.002 | 0.018 | 0.045 | 0.024 | 0.006 | 0.003 | ||
| c2 | 0 | 0.001 | 0.014 | 0.081 | 0.062 | 0.012 | 0.007 | ||
| c3 | 0 | 0 | 0.004 | 0.087 | 0.197 | 0.09 | 0.014 | ||
| c4 | 0 | 0 | 0.001 | 0.006 | 0.044 | 0.089 | 0.024 | ||
| c5 | 0 | 0 | 0 | 0.003 | 0.029 | 0.087 | 0.038 | ||
| c6 | 0 | 0 | 0 | 0.001 | 0.002 | 0.004 | 0.002 | ||
See category definitions for details.
Statistical distribution
|
|
Sea ice thickness, day 1 forecast

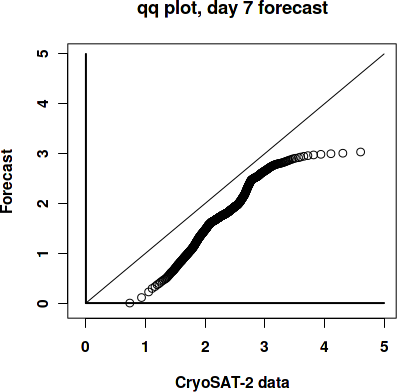
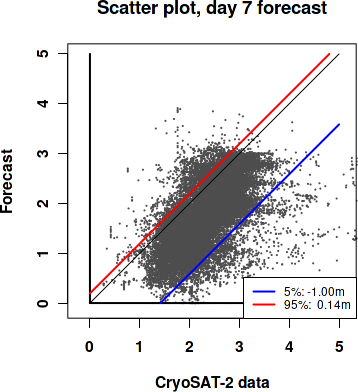
Day 7 forecast vs. observations
Contingency table
| observations | |||||||||
|---|---|---|---|---|---|---|---|---|---|
| open | c1 | c2 | c3 | c4 | c5 | c6 | |||
| m o d e l |
open | 0 | 0 | 0 | 0 | 0.001 | 0 | 0 | |
| c1 | 0 | 0.002 | 0.018 | 0.046 | 0.025 | 0.006 | 0.003 | ||
| c2 | 0 | 0.001 | 0.014 | 0.082 | 0.061 | 0.011 | 0.007 | ||
| c3 | 0 | 0 | 0.004 | 0.085 | 0.199 | 0.09 | 0.014 | ||
| c4 | 0 | 0 | 0.001 | 0.007 | 0.043 | 0.09 | 0.025 | ||
| c5 | 0 | 0 | 0 | 0.003 | 0.03 | 0.087 | 0.038 | ||
| c6 | 0 | 0 | 0 | 0.001 | 0.002 | 0.003 | 0.002 | ||
See category definitions for details.
Statistical distribution
|
|
Sea ice thickness, day 7 forecast
Generated by /metno/routine/sms/V2/SIthickness/c2iceWebPage.sh Fri 04 Jun 2021 02:02:43 AM UTC on arcval