Validation of ice thickness - Full domain
Bulletin date: 2021-05-06
Model: ARC MFC - TOPAZ
Data source: UCL CryoSAT-2 sea ice thickness
Validation statistics summary
| Bias (m) | RMS (m) | total grids | low SIT | OK SIT | high SIT | |
|---|---|---|---|---|---|---|
| Best estimate | -0.52 | 0.76 | 42948 | 5440 | 37307 | 201 |
| Day 1 forecast | -0.52 | 0.76 | 42948 | 5442 | 37301 | 205 |
| Day 4 forecast | -0.52 | 0.76 | 42948 | 5495 | 37253 | 200 |
| Day 7 forecast | -0.52 | 0.76 | 42948 | 5448 | 37294 | 206 |
| Day 10 forecast | -0.52 | 0.77 | 42948 | 5566 | 37173 | 209 |
Numbers in the three rightmost columns are grid counts. Regions with high/low sea ice thickness correspond to areas with model offsets from the gridded observations outside of one standard deviation. (Standard deviations are provided in the observational product.)
Definition of categories:
| Category | Sea ice thickness |
|---|---|
| c1 | <1m |
| c2 | 1 - 1.5m |
| c3 | 1.5 - 2m |
| c4 | 2 - 2.5m |
| c5 | 2.5 - 3m |
| c6 | >3m |
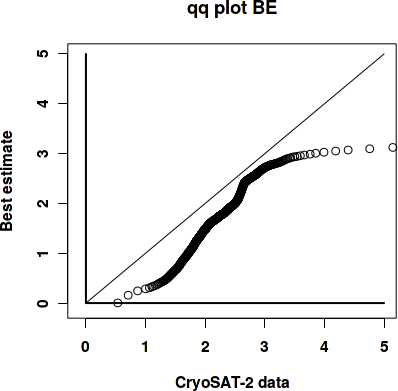
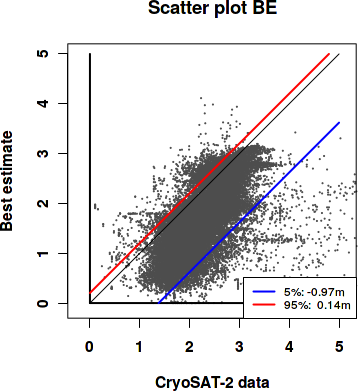
Best estimate vs. observations
Contingency table
| observations | |||||||||
|---|---|---|---|---|---|---|---|---|---|
| open | c1 | c2 | c3 | c4 | c5 | c6 | |||
| m o d e l |
open | 0 | 0 | 0 | 0.001 | 0 | 0 | 0 | |
| c1 | 0 | 0.002 | 0.023 | 0.064 | 0.025 | 0.006 | 0.003 | ||
| c2 | 0 | 0.001 | 0.013 | 0.104 | 0.059 | 0.014 | 0.006 | ||
| c3 | 0 | 0.001 | 0.006 | 0.089 | 0.217 | 0.058 | 0.009 | ||
| c4 | 0 | 0 | 0.001 | 0.004 | 0.057 | 0.082 | 0.011 | ||
| c5 | 0 | 0 | 0 | 0.002 | 0.033 | 0.074 | 0.026 | ||
| c6 | 0 | 0 | 0 | 0 | 0.001 | 0.002 | 0.006 | ||
See category definitions for details.
Statistical distribution
|
|
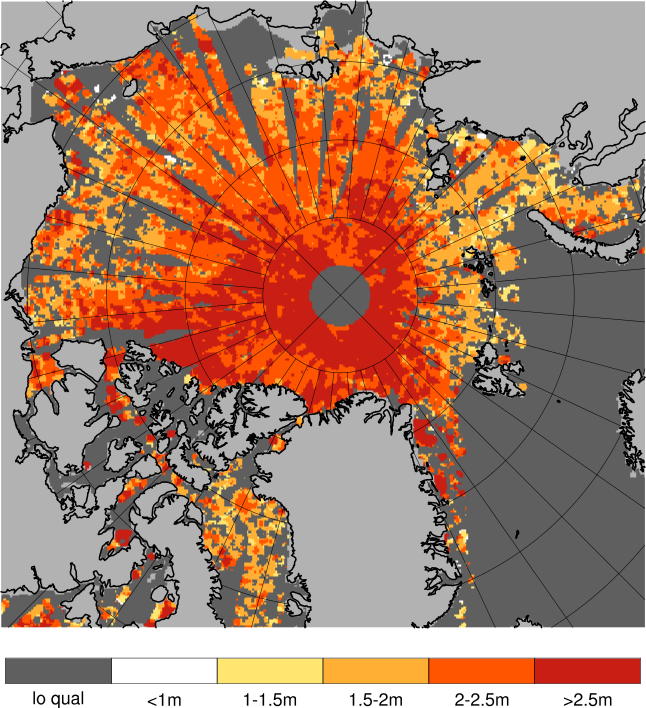
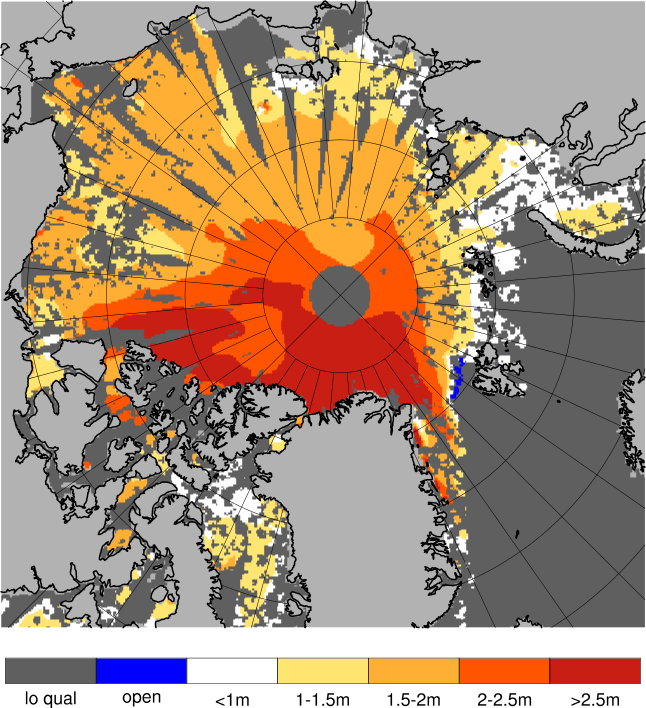
Observed sea ice thickness from CryoSAT
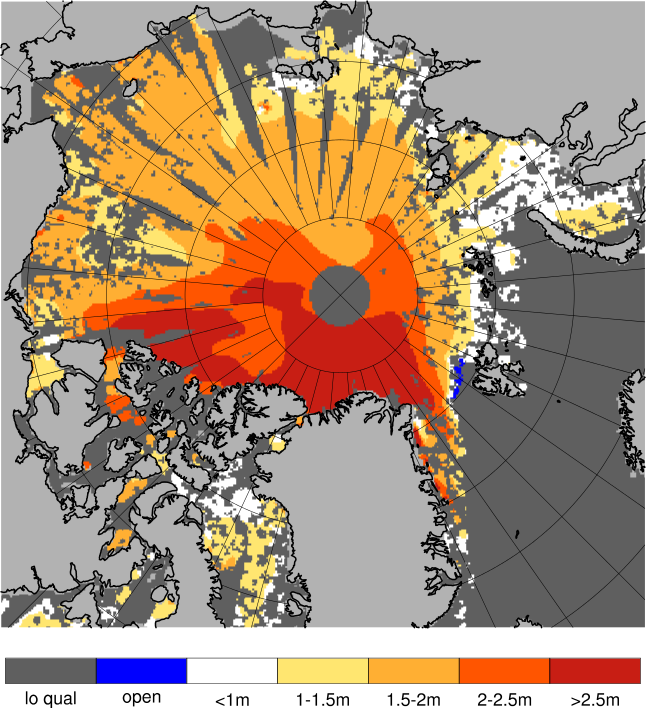
Sea ice thickness, best estimate product
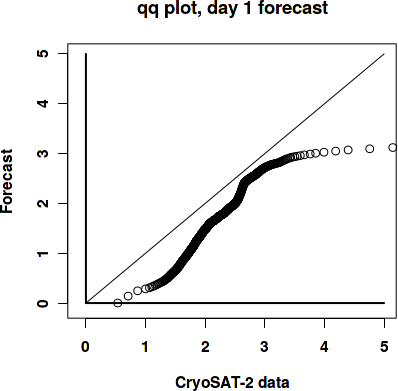
Day 1 forecast vs. observations
Contingency table
| observations | |||||||||
|---|---|---|---|---|---|---|---|---|---|
| open | c1 | c2 | c3 | c4 | c5 | c6 | |||
| m o d e l |
open | 0 | 0 | 0 | 0.001 | 0 | 0 | 0 | |
| c1 | 0 | 0.002 | 0.023 | 0.064 | 0.026 | 0.005 | 0.003 | ||
| c2 | 0 | 0.001 | 0.013 | 0.103 | 0.059 | 0.014 | 0.006 | ||
| c3 | 0 | 0.001 | 0.005 | 0.089 | 0.218 | 0.059 | 0.009 | ||
| c4 | 0 | 0 | 0.001 | 0.004 | 0.056 | 0.081 | 0.011 | ||
| c5 | 0 | 0 | 0 | 0.002 | 0.033 | 0.075 | 0.026 | ||
| c6 | 0 | 0 | 0 | 0 | 0.001 | 0.002 | 0.006 | ||
See category definitions for details.
Statistical distribution
|

|
Sea ice thickness, day 1 forecast
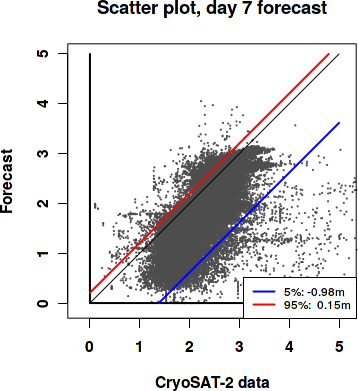
Day 7 forecast vs. observations
Contingency table
| observations | |||||||||
|---|---|---|---|---|---|---|---|---|---|
| open | c1 | c2 | c3 | c4 | c5 | c6 | |||
| m o d e l |
open | 0 | 0 | 0 | 0.001 | 0 | 0 | 0 | |
| c1 | 0 | 0.002 | 0.023 | 0.063 | 0.025 | 0.005 | 0.003 | ||
| c2 | 0 | 0.001 | 0.013 | 0.104 | 0.059 | 0.014 | 0.006 | ||
| c3 | 0 | 0.001 | 0.006 | 0.09 | 0.219 | 0.059 | 0.009 | ||
| c4 | 0 | 0 | 0.001 | 0.004 | 0.056 | 0.081 | 0.011 | ||
| c5 | 0 | 0 | 0 | 0.002 | 0.033 | 0.074 | 0.026 | ||
| c6 | 0 | 0 | 0 | 0 | 0.001 | 0.002 | 0.006 | ||
See category definitions for details.
Statistical distribution

|
|
Sea ice thickness, day 7 forecast

Generated by /metno/routine/sms/V2/SIthickness/c2iceWebPage.sh Fri May 21 02:06:16 UTC 2021 on arcmfcval