Validation of ice thickness - Full domain
Bulletin date: 2021-04-15
Model: ARC MFC - TOPAZ
Data source: UCL CryoSAT-2 sea ice thickness
Validation statistics summary
| Bias (m) | RMS (m) | total grids | low SIT | OK SIT | high SIT | |
|---|---|---|---|---|---|---|
| Best estimate | -0.37 | 0.69 | 46043 | 5847 | 40042 | 154 |
| Day 1 forecast | -0.37 | 0.69 | 46043 | 5755 | 40126 | 162 |
| Day 4 forecast | -0.38 | 0.69 | 46043 | 5818 | 40051 | 174 |
| Day 7 forecast | -0.37 | 0.69 | 46043 | 5644 | 40224 | 175 |
| Day 10 forecast | -0.37 | 0.68 | 46043 | 5421 | 40434 | 188 |
Numbers in the three rightmost columns are grid counts. Regions with high/low sea ice thickness correspond to areas with model offsets from the gridded observations outside of one standard deviation. (Standard deviations are provided in the observational product.)
Definition of categories:
| Category | Sea ice thickness |
|---|---|
| c1 | <1m |
| c2 | 1 - 1.5m |
| c3 | 1.5 - 2m |
| c4 | 2 - 2.5m |
| c5 | 2.5 - 3m |
| c6 | >3m |
Best estimate vs. observations
Contingency table
| observations | |||||||||
|---|---|---|---|---|---|---|---|---|---|
| open | c1 | c2 | c3 | c4 | c5 | c6 | |||
| m o d e l |
open | 0 | 0 | 0 | 0 | 0 | 0 | 0 | |
| c1 | 0 | 0.004 | 0.042 | 0.079 | 0.022 | 0.003 | 0.001 | ||
| c2 | 0 | 0.001 | 0.027 | 0.114 | 0.039 | 0.006 | 0.004 | ||
| c3 | 0 | 0 | 0.022 | 0.183 | 0.114 | 0.024 | 0.006 | ||
| c4 | 0 | 0 | 0.001 | 0.024 | 0.129 | 0.047 | 0.008 | ||
| c5 | 0 | 0 | 0 | 0.001 | 0.022 | 0.051 | 0.012 | ||
| c6 | 0 | 0 | 0 | 0 | 0.001 | 0.004 | 0.008 | ||
See category definitions for details.
Statistical distribution
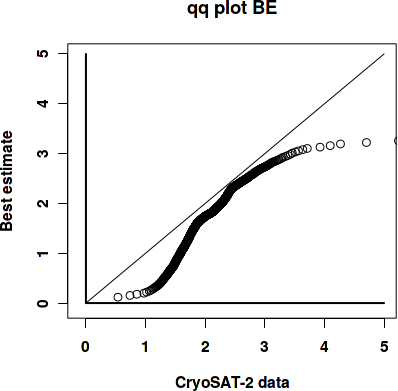
|
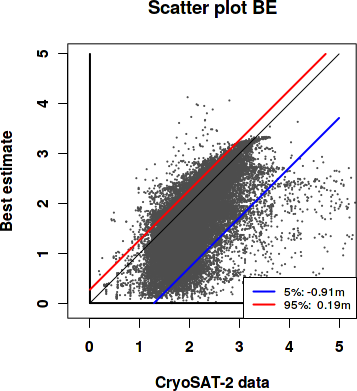
|
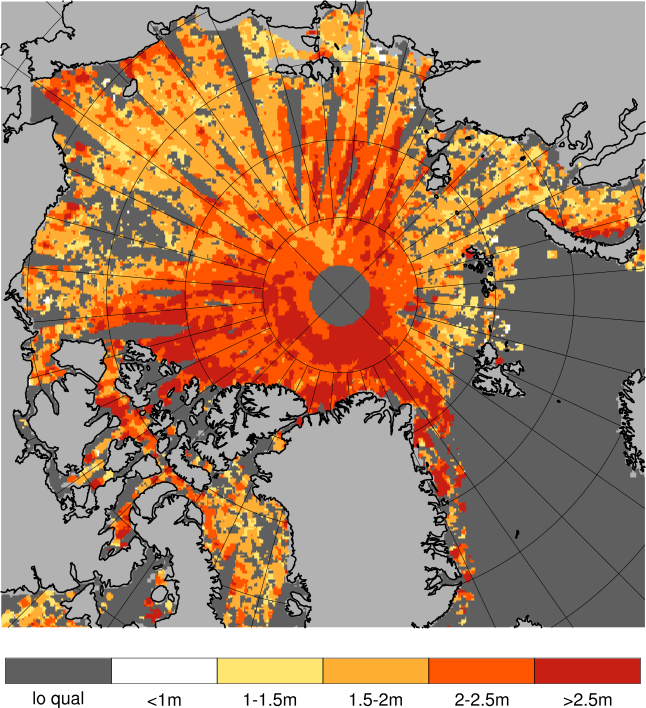
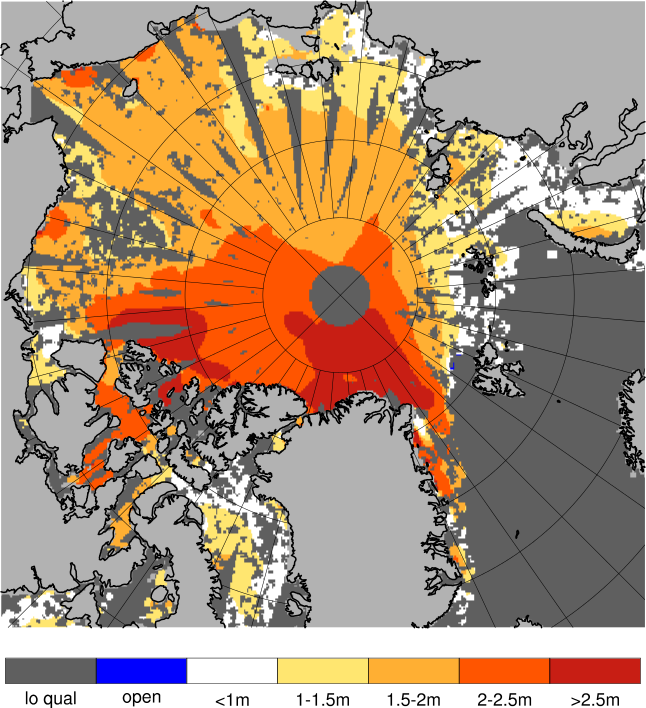
Observed sea ice thickness from CryoSAT
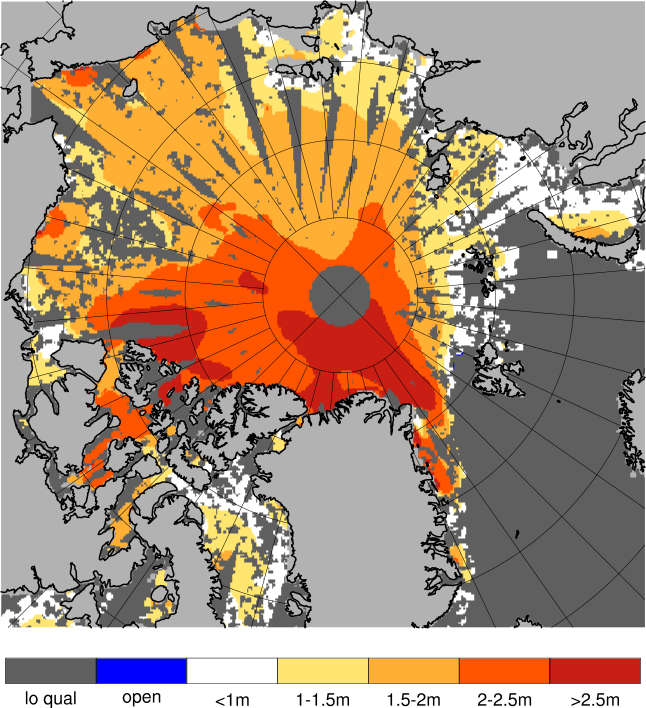
Sea ice thickness, best estimate product
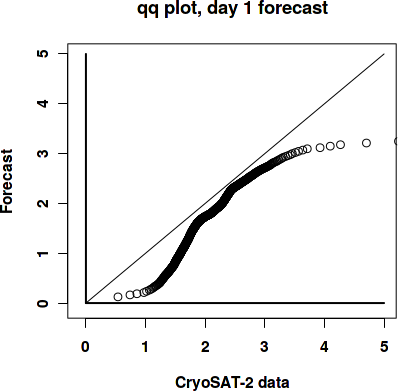
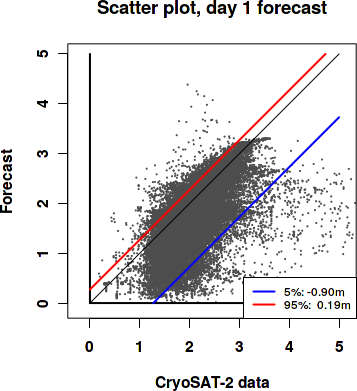
Day 1 forecast vs. observations
Contingency table
| observations | |||||||||
|---|---|---|---|---|---|---|---|---|---|
| open | c1 | c2 | c3 | c4 | c5 | c6 | |||
| m o d e l |
open | 0 | 0 | 0 | 0 | 0 | 0 | 0 | |
| c1 | 0 | 0.004 | 0.042 | 0.08 | 0.022 | 0.003 | 0.001 | ||
| c2 | 0 | 0.001 | 0.027 | 0.113 | 0.038 | 0.006 | 0.004 | ||
| c3 | 0 | 0 | 0.023 | 0.185 | 0.121 | 0.024 | 0.007 | ||
| c4 | 0 | 0 | 0.002 | 0.023 | 0.124 | 0.051 | 0.008 | ||
| c5 | 0 | 0 | 0 | 0.001 | 0.021 | 0.047 | 0.011 | ||
| c6 | 0 | 0 | 0 | 0 | 0.001 | 0.003 | 0.008 | ||
See category definitions for details.
Statistical distribution
|
|
Sea ice thickness, day 1 forecast

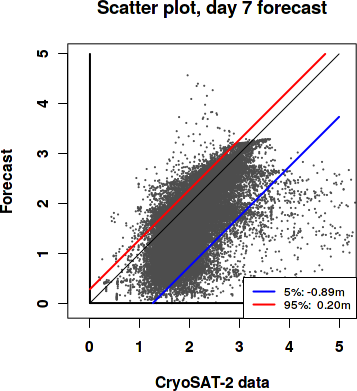
Day 7 forecast vs. observations
Contingency table
| observations | |||||||||
|---|---|---|---|---|---|---|---|---|---|
| open | c1 | c2 | c3 | c4 | c5 | c6 | |||
| m o d e l |
open | 0 | 0 | 0 | 0 | 0 | 0 | 0 | |
| c1 | 0 | 0.004 | 0.041 | 0.078 | 0.021 | 0.003 | 0.001 | ||
| c2 | 0 | 0.001 | 0.027 | 0.112 | 0.038 | 0.005 | 0.004 | ||
| c3 | 0 | 0 | 0.023 | 0.188 | 0.124 | 0.025 | 0.007 | ||
| c4 | 0 | 0 | 0.002 | 0.023 | 0.122 | 0.051 | 0.008 | ||
| c5 | 0 | 0 | 0 | 0.001 | 0.021 | 0.047 | 0.011 | ||
| c6 | 0 | 0 | 0 | 0 | 0.001 | 0.003 | 0.007 | ||
See category definitions for details.
Statistical distribution

|
|
Sea ice thickness, day 7 forecast
Generated by /metno/routine/sms/V2/SIthickness/c2iceWebPage.sh Fri Apr 30 02:07:35 UTC 2021 on arcmfcval