Validation of ice thickness - Full domain
Bulletin date: 2021-04-08
Model: ARC MFC - TOPAZ
Data source: UCL CryoSAT-2 sea ice thickness
Validation statistics summary
| Bias (m) | RMS (m) | total grids | low SIT | OK SIT | high SIT | |
|---|---|---|---|---|---|---|
| Best estimate | -0.36 | 0.73 | 46210 | 6169 | 39871 | 170 |
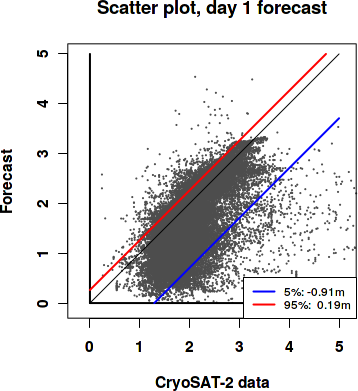
| Day 1 forecast | -0.35 | 0.72 | 46210 | 6008 | 40025 | 177 |
| Day 4 forecast | -0.36 | 0.72 | 46210 | 6012 | 40019 | 179 |
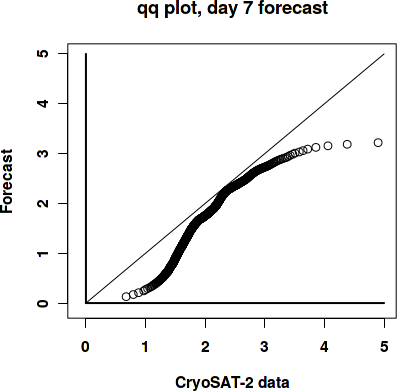
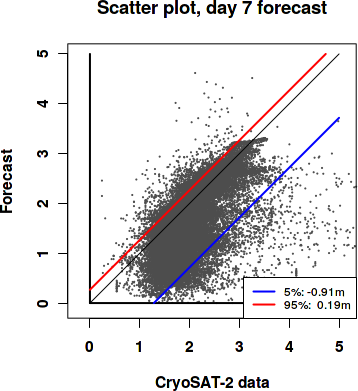
| Day 7 forecast | -0.35 | 0.72 | 46210 | 5819 | 40206 | 185 |
| Day 10 forecast | -0.35 | 0.71 | 46210 | 5621 | 40409 | 180 |
Numbers in the three rightmost columns are grid counts. Regions with high/low sea ice thickness correspond to areas with model offsets from the gridded observations outside of one standard deviation. (Standard deviations are provided in the observational product.)
Definition of categories:
| Category | Sea ice thickness |
|---|---|
| c1 | <1m |
| c2 | 1 - 1.5m |
| c3 | 1.5 - 2m |
| c4 | 2 - 2.5m |
| c5 | 2.5 - 3m |
| c6 | >3m |
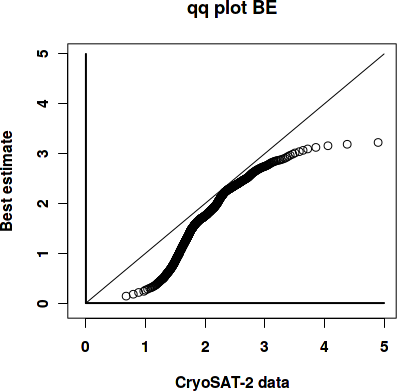
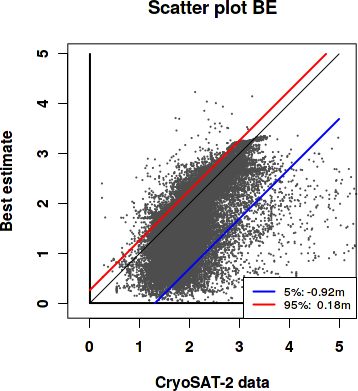
Best estimate vs. observations
Contingency table
| observations | |||||||||
|---|---|---|---|---|---|---|---|---|---|
| open | c1 | c2 | c3 | c4 | c5 | c6 | |||
| m o d e l |
open | 0 | 0 | 0 | 0 | 0 | 0 | 0 | |
| c1 | 0 | 0.004 | 0.052 | 0.09 | 0.021 | 0.004 | 0.002 | ||
| c2 | 0 | 0.001 | 0.039 | 0.12 | 0.034 | 0.007 | 0.004 | ||
| c3 | 0 | 0 | 0.025 | 0.212 | 0.08 | 0.008 | 0.005 | ||
| c4 | 0 | 0 | 0.001 | 0.026 | 0.131 | 0.036 | 0.007 | ||
| c5 | 0 | 0 | 0 | 0.001 | 0.018 | 0.047 | 0.013 | ||
| c6 | 0 | 0 | 0 | 0 | 0 | 0.004 | 0.007 | ||
See category definitions for details.
Statistical distribution
|
|
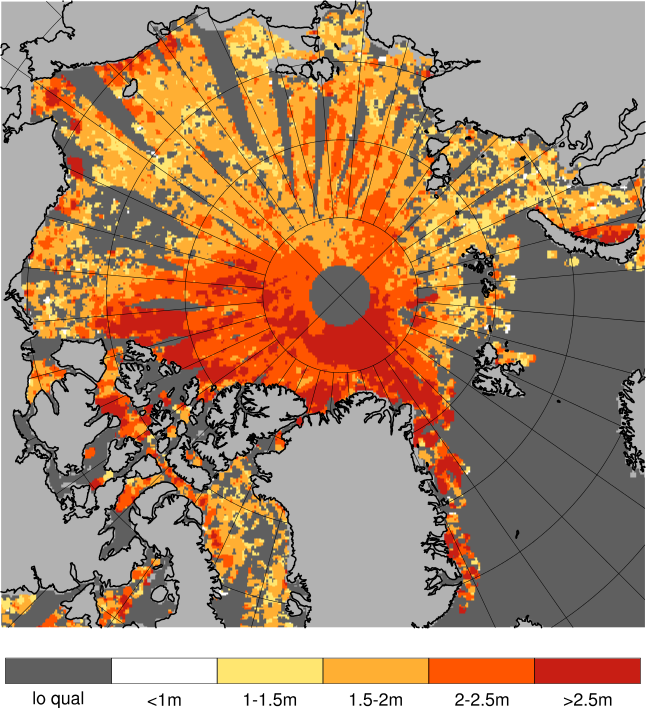
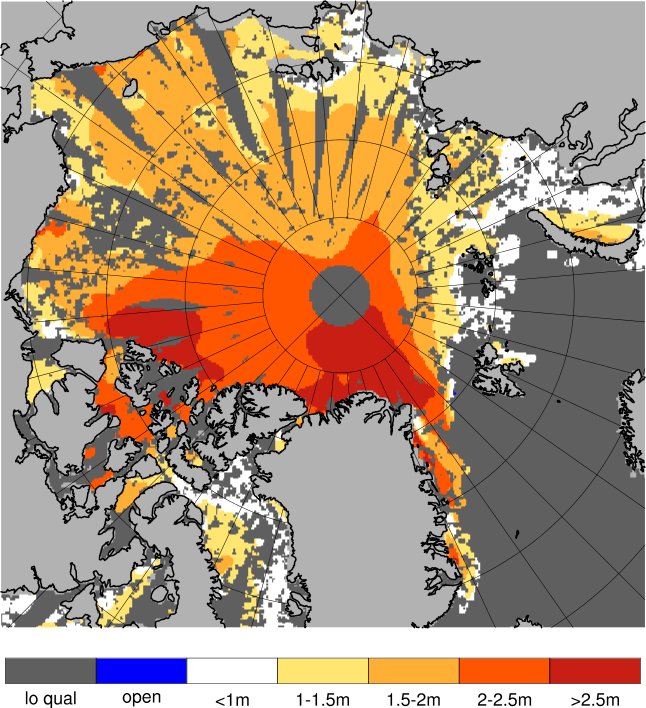
Observed sea ice thickness from CryoSAT
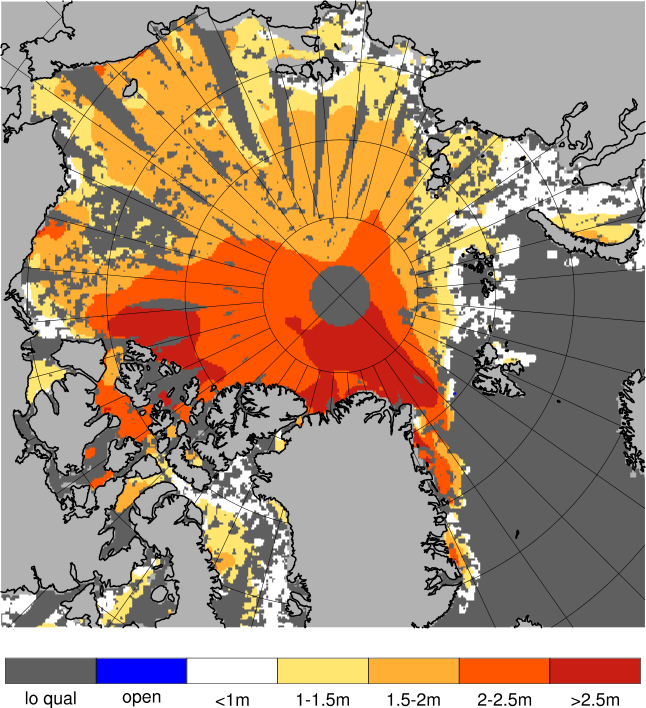
Sea ice thickness, best estimate product
Day 1 forecast vs. observations
Contingency table
| observations | |||||||||
|---|---|---|---|---|---|---|---|---|---|
| open | c1 | c2 | c3 | c4 | c5 | c6 | |||
| m o d e l |
open | 0 | 0 | 0 | 0 | 0 | 0 | 0 | |
| c1 | 0 | 0.004 | 0.05 | 0.086 | 0.02 | 0.004 | 0.002 | ||
| c2 | 0 | 0.001 | 0.041 | 0.127 | 0.036 | 0.008 | 0.004 | ||
| c3 | 0 | 0 | 0.025 | 0.21 | 0.079 | 0.008 | 0.006 | ||
| c4 | 0 | 0 | 0.001 | 0.025 | 0.13 | 0.037 | 0.006 | ||
| c5 | 0 | 0 | 0 | 0.002 | 0.017 | 0.045 | 0.013 | ||
| c6 | 0 | 0 | 0 | 0 | 0.001 | 0.004 | 0.007 | ||
See category definitions for details.
Statistical distribution

|
|
Sea ice thickness, day 1 forecast

Day 7 forecast vs. observations
Contingency table
| observations | |||||||||
|---|---|---|---|---|---|---|---|---|---|
| open | c1 | c2 | c3 | c4 | c5 | c6 | |||
| m o d e l |
open | 0 | 0 | 0 | 0 | 0 | 0 | 0 | |
| c1 | 0 | 0.004 | 0.048 | 0.082 | 0.019 | 0.003 | 0.002 | ||
| c2 | 0 | 0.001 | 0.042 | 0.125 | 0.038 | 0.008 | 0.005 | ||
| c3 | 0 | 0 | 0.027 | 0.215 | 0.08 | 0.008 | 0.006 | ||
| c4 | 0 | 0 | 0.001 | 0.025 | 0.129 | 0.038 | 0.006 | ||
| c5 | 0 | 0 | 0 | 0.002 | 0.018 | 0.044 | 0.013 | ||
| c6 | 0 | 0 | 0 | 0 | 0.001 | 0.004 | 0.007 | ||
See category definitions for details.
Statistical distribution
|
|
Sea ice thickness, day 7 forecast
Generated by /metno/routine/sms/V2/SIthickness/c2iceWebPage.sh Fri Apr 23 02:09:52 UTC 2021 on arcmfcval