Validation of ice thickness - Full domain
Bulletin date: 2021-04-01
Model: ARC MFC - TOPAZ
Data source: UCL CryoSAT-2 sea ice thickness
Validation statistics summary
| Bias (m) | RMS (m) | total grids | low SIT | OK SIT | high SIT | |
|---|---|---|---|---|---|---|
| Best estimate | -0.39 | 0.72 | 47695 | 6706 | 40880 | 109 |
| Day 1 forecast | -0.39 | 0.71 | 47695 | 6506 | 41076 | 113 |
| Day 4 forecast | -0.39 | 0.71 | 47695 | 6471 | 41113 | 111 |
| Day 7 forecast | -0.38 | 0.71 | 47695 | 6411 | 41151 | 133 |
| Day 10 forecast | -0.43 | 0.72 | 47695 | 6583 | 41001 | 111 |
Numbers in the three rightmost columns are grid counts. Regions with high/low sea ice thickness correspond to areas with model offsets from the gridded observations outside of one standard deviation. (Standard deviations are provided in the observational product.)
Definition of categories:
| Category | Sea ice thickness |
|---|---|
| c1 | <1m |
| c2 | 1 - 1.5m |
| c3 | 1.5 - 2m |
| c4 | 2 - 2.5m |
| c5 | 2.5 - 3m |
| c6 | >3m |
Best estimate vs. observations
Contingency table
| observations | |||||||||
|---|---|---|---|---|---|---|---|---|---|
| open | c1 | c2 | c3 | c4 | c5 | c6 | |||
| m o d e l |
open | 0 | 0 | 0 | 0 | 0 | 0 | 0 | |
| c1 | 0 | 0.003 | 0.049 | 0.095 | 0.023 | 0.006 | 0.006 | ||
| c2 | 0 | 0.001 | 0.05 | 0.132 | 0.033 | 0.009 | 0.003 | ||
| c3 | 0 | 0 | 0.018 | 0.203 | 0.072 | 0.01 | 0.003 | ||
| c4 | 0 | 0 | 0.001 | 0.021 | 0.135 | 0.037 | 0.007 | ||
| c5 | 0 | 0 | 0 | 0.001 | 0.013 | 0.041 | 0.017 | ||
| c6 | 0 | 0 | 0 | 0 | 0 | 0.002 | 0.009 | ||
See category definitions for details.
Statistical distribution
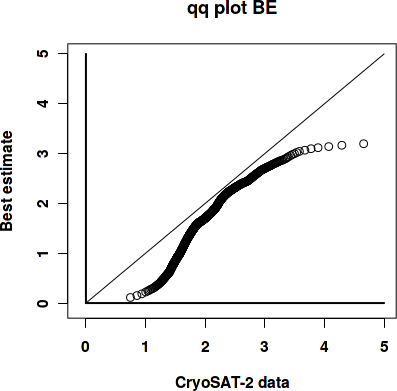
|
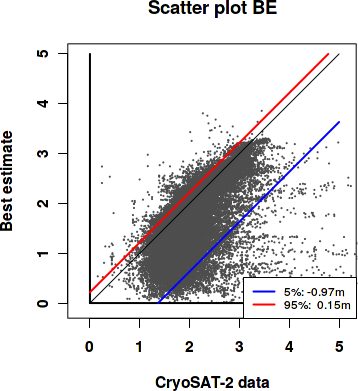
|
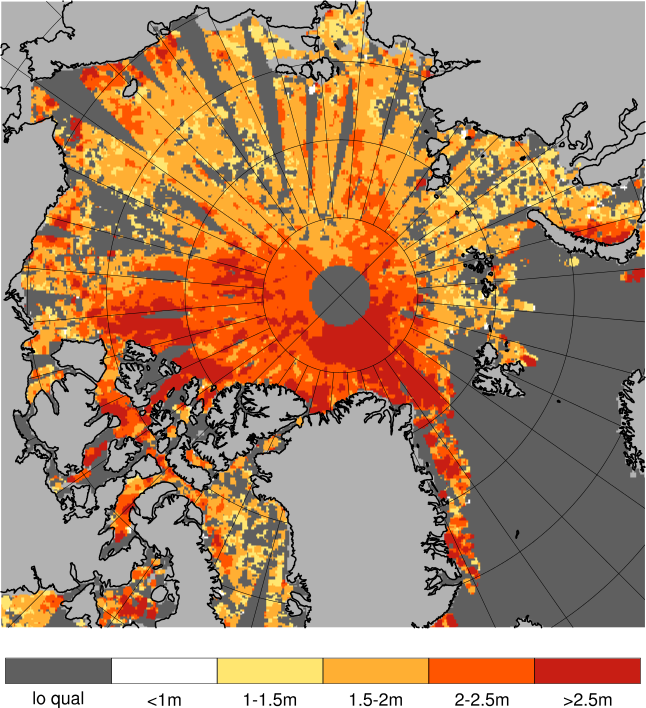
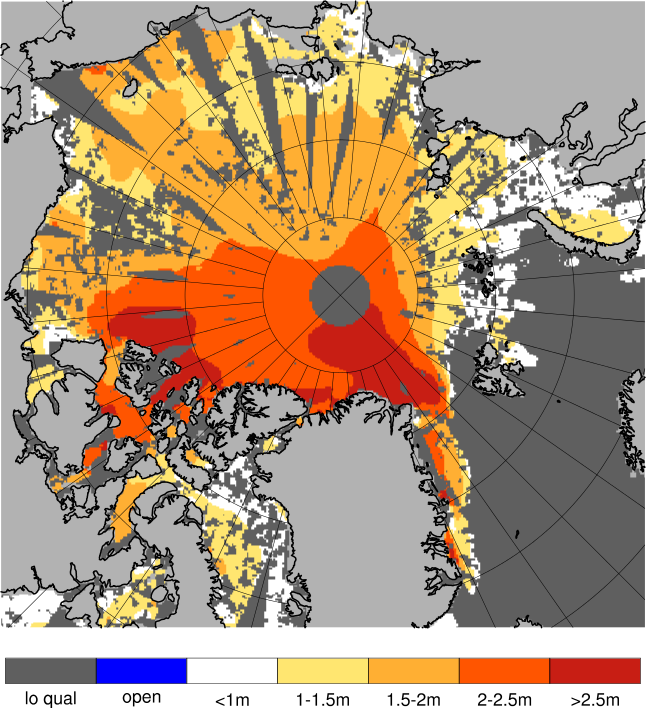
Observed sea ice thickness from CryoSAT
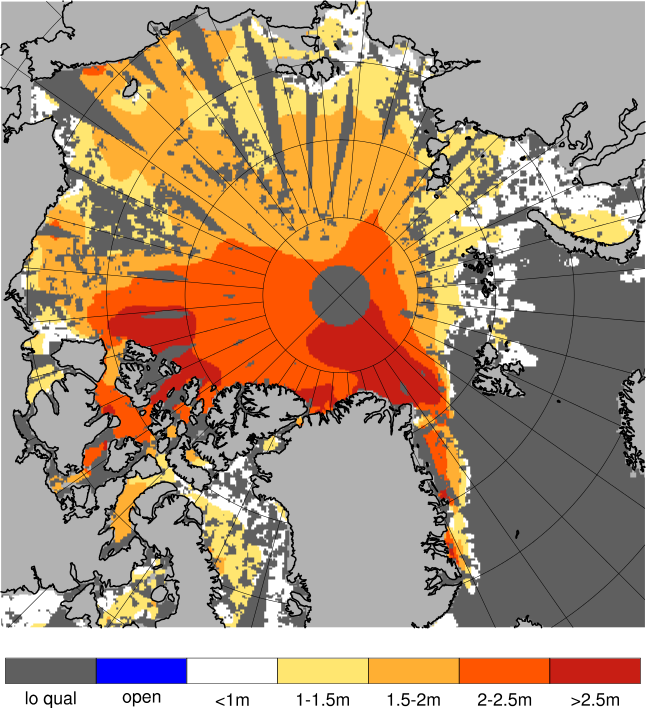
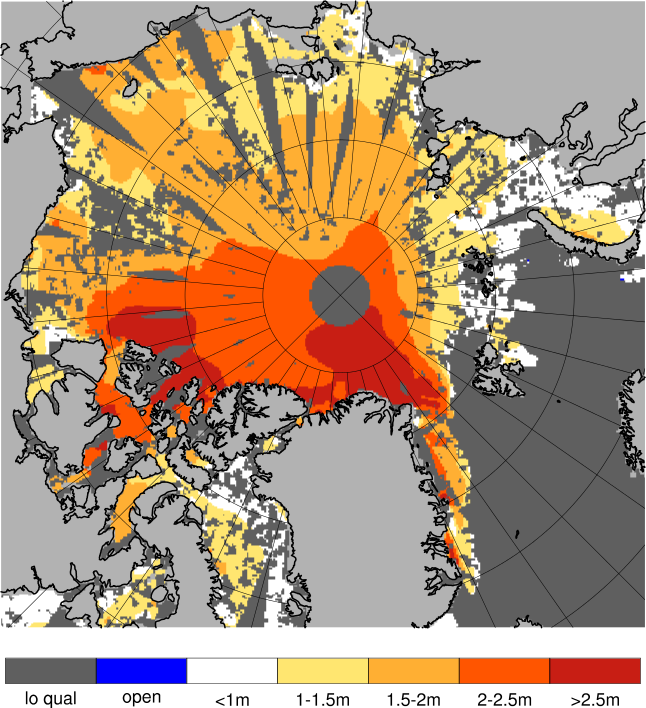
Sea ice thickness, best estimate product
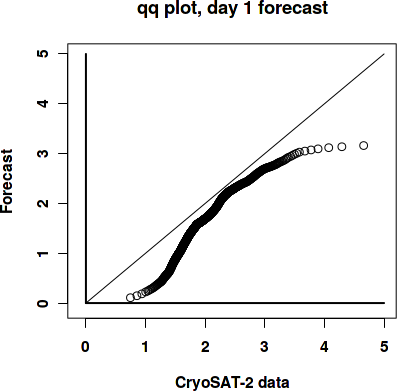
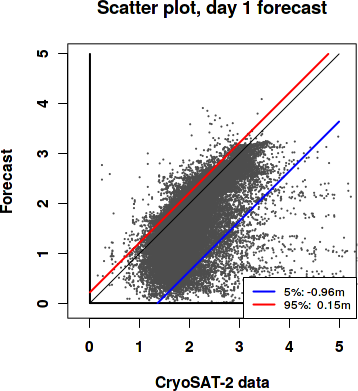
Day 1 forecast vs. observations
Contingency table
| observations | |||||||||
|---|---|---|---|---|---|---|---|---|---|
| open | c1 | c2 | c3 | c4 | c5 | c6 | |||
| m o d e l |
open | 0 | 0 | 0 | 0 | 0 | 0 | 0 | |
| c1 | 0 | 0.003 | 0.046 | 0.087 | 0.021 | 0.006 | 0.006 | ||
| c2 | 0 | 0.001 | 0.053 | 0.144 | 0.035 | 0.009 | 0.004 | ||
| c3 | 0 | 0 | 0.018 | 0.199 | 0.074 | 0.011 | 0.004 | ||
| c4 | 0 | 0 | 0.001 | 0.021 | 0.133 | 0.037 | 0.006 | ||
| c5 | 0 | 0 | 0 | 0.001 | 0.012 | 0.04 | 0.018 | ||
| c6 | 0 | 0 | 0 | 0 | 0 | 0.003 | 0.008 | ||
See category definitions for details.
Statistical distribution
|
|
Sea ice thickness, day 1 forecast
Day 7 forecast vs. observations
Contingency table
| observations | |||||||||
|---|---|---|---|---|---|---|---|---|---|
| open | c1 | c2 | c3 | c4 | c5 | c6 | |||
| m o d e l |
open | 0 | 0 | 0 | 0 | 0 | 0 | 0 | |
| c1 | 0 | 0.002 | 0.044 | 0.083 | 0.021 | 0.006 | 0.006 | ||
| c2 | 0 | 0.001 | 0.054 | 0.143 | 0.034 | 0.009 | 0.004 | ||
| c3 | 0 | 0 | 0.019 | 0.202 | 0.077 | 0.011 | 0.004 | ||
| c4 | 0 | 0 | 0.001 | 0.021 | 0.128 | 0.037 | 0.006 | ||
| c5 | 0 | 0 | 0 | 0.002 | 0.015 | 0.039 | 0.018 | ||
| c6 | 0 | 0 | 0 | 0 | 0.001 | 0.003 | 0.008 | ||
See category definitions for details.
Statistical distribution

|

|
Sea ice thickness, day 7 forecast
Generated by /metno/routine/sms/V2/SIthickness/c2iceWebPage.sh Fri Apr 16 02:11:01 UTC 2021 on arcmfcval