Validation of ice thickness - Full domain
Bulletin date: 2021-03-25
Model: ARC MFC - TOPAZ
Data source: UCL CryoSAT-2 sea ice thickness
Validation statistics summary
| Bias (m) | RMS (m) | total grids | low SIT | OK SIT | high SIT | |
|---|---|---|---|---|---|---|
| Best estimate | -0.44 | 0.72 | 47580 | 6351 | 41119 | 110 |
| Day 1 forecast | -0.46 | 0.73 | 47580 | 6512 | 40962 | 106 |
| Day 4 forecast | -0.47 | 0.74 | 47580 | 6611 | 40853 | 116 |
| Day 7 forecast | -0.45 | 0.73 | 47580 | 6500 | 40967 | 113 |
| Day 10 forecast | -0.51 | 0.76 | 47580 | 7081 | 40414 | 85 |
Numbers in the three rightmost columns are grid counts. Regions with high/low sea ice thickness correspond to areas with model offsets from the gridded observations outside of one standard deviation. (Standard deviations are provided in the observational product.)
Definition of categories:
| Category | Sea ice thickness |
|---|---|
| c1 | <1m |
| c2 | 1 - 1.5m |
| c3 | 1.5 - 2m |
| c4 | 2 - 2.5m |
| c5 | 2.5 - 3m |
| c6 | >3m |
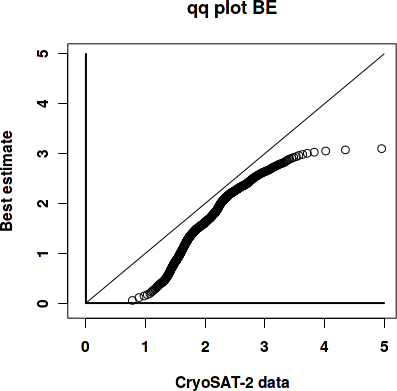
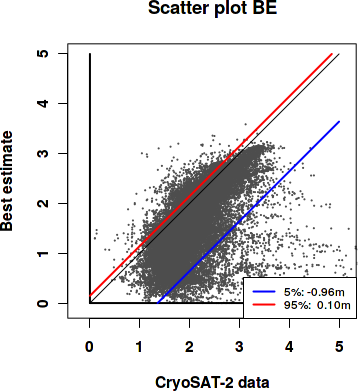
Best estimate vs. observations
Contingency table
| observations | |||||||||
|---|---|---|---|---|---|---|---|---|---|
| open | c1 | c2 | c3 | c4 | c5 | c6 | |||
| m o d e l |
open | 0 | 0 | 0 | 0 | 0 | 0 | 0 | |
| c1 | 0 | 0.002 | 0.046 | 0.088 | 0.02 | 0.005 | 0.007 | ||
| c2 | 0 | 0.001 | 0.046 | 0.172 | 0.043 | 0.008 | 0.005 | ||
| c3 | 0 | 0 | 0.01 | 0.167 | 0.098 | 0.01 | 0.003 | ||
| c4 | 0 | 0 | 0.001 | 0.019 | 0.123 | 0.049 | 0.006 | ||
| c5 | 0 | 0 | 0 | 0.001 | 0.009 | 0.035 | 0.019 | ||
| c6 | 0 | 0 | 0 | 0 | 0 | 0 | 0.007 | ||
See category definitions for details.
Statistical distribution
|
|
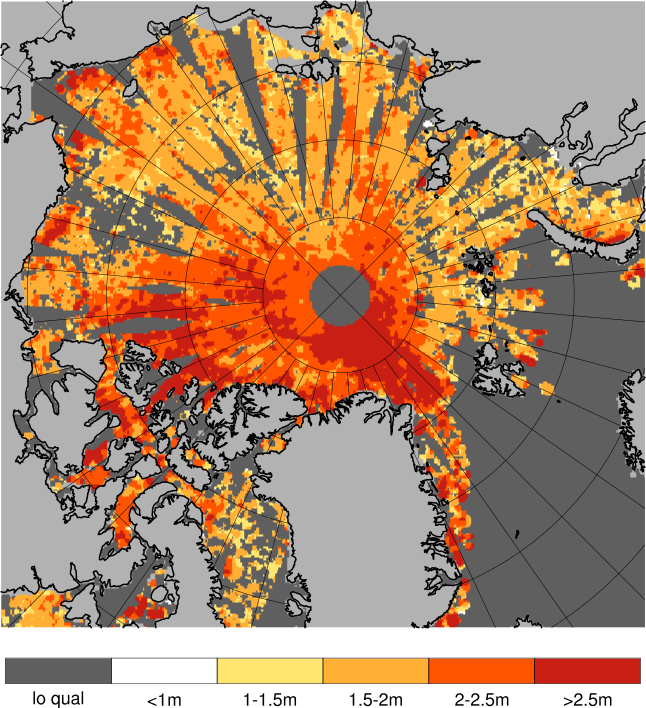
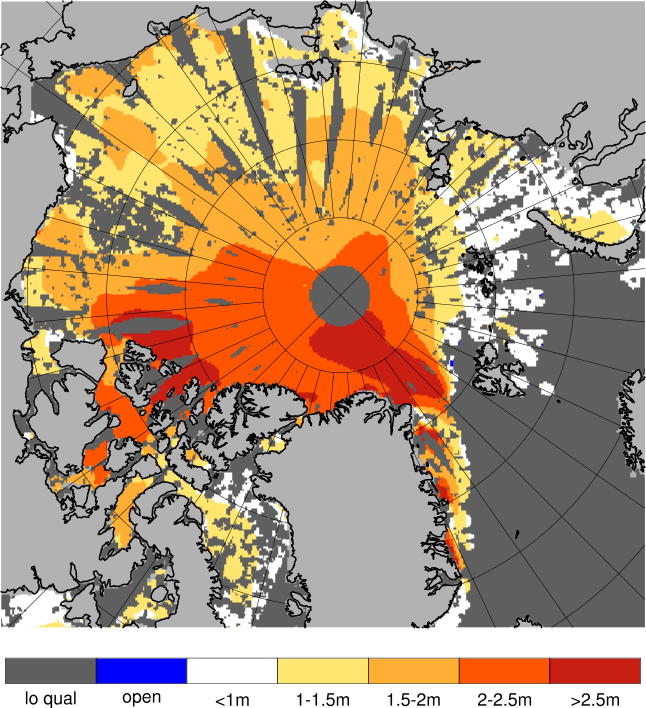
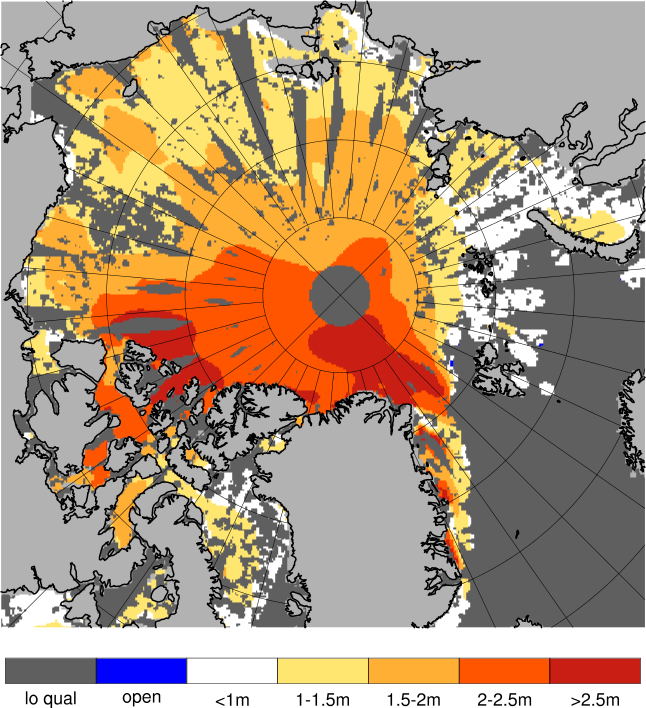
Observed sea ice thickness from CryoSAT
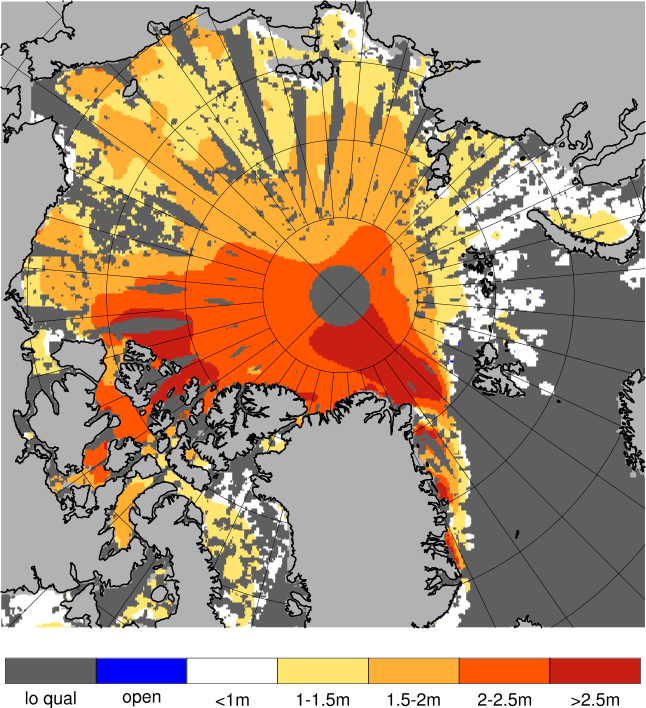
Sea ice thickness, best estimate product
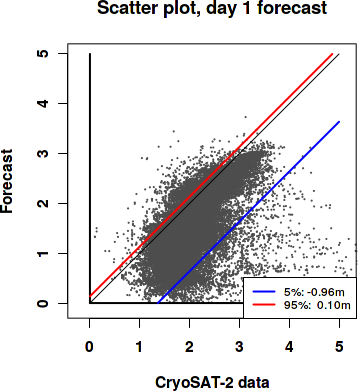
Day 1 forecast vs. observations
Contingency table
| observations | |||||||||
|---|---|---|---|---|---|---|---|---|---|
| open | c1 | c2 | c3 | c4 | c5 | c6 | |||
| m o d e l |
open | 0 | 0 | 0 | 0 | 0 | 0 | 0 | |
| c1 | 0 | 0.002 | 0.047 | 0.091 | 0.021 | 0.005 | 0.007 | ||
| c2 | 0 | 0.001 | 0.048 | 0.185 | 0.047 | 0.009 | 0.005 | ||
| c3 | 0 | 0 | 0.008 | 0.152 | 0.102 | 0.01 | 0.004 | ||
| c4 | 0 | 0 | 0.001 | 0.017 | 0.116 | 0.051 | 0.006 | ||
| c5 | 0 | 0 | 0 | 0.001 | 0.008 | 0.032 | 0.021 | ||
| c6 | 0 | 0 | 0 | 0 | 0 | 0 | 0.003 | ||
See category definitions for details.
Statistical distribution

|
|
Sea ice thickness, day 1 forecast
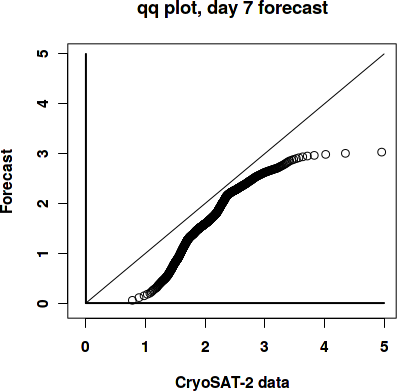
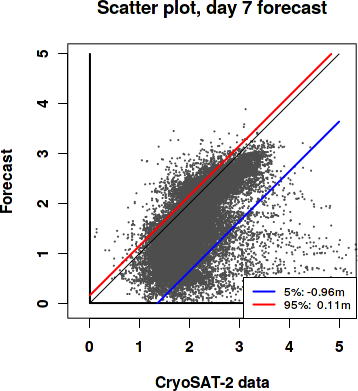
Day 7 forecast vs. observations
Contingency table
| observations | |||||||||
|---|---|---|---|---|---|---|---|---|---|
| open | c1 | c2 | c3 | c4 | c5 | c6 | |||
| m o d e l |
open | 0 | 0 | 0 | 0 | 0 | 0 | 0 | |
| c1 | 0 | 0.002 | 0.046 | 0.09 | 0.021 | 0.005 | 0.006 | ||
| c2 | 0 | 0.001 | 0.049 | 0.187 | 0.047 | 0.008 | 0.005 | ||
| c3 | 0 | 0 | 0.008 | 0.152 | 0.104 | 0.01 | 0.004 | ||
| c4 | 0 | 0 | 0.001 | 0.017 | 0.111 | 0.05 | 0.007 | ||
| c5 | 0 | 0 | 0 | 0.001 | 0.01 | 0.033 | 0.021 | ||
| c6 | 0 | 0 | 0 | 0 | 0 | 0.001 | 0.003 | ||
See category definitions for details.
Statistical distribution
|
|
Sea ice thickness, day 7 forecast
Generated by /metno/routine/sms/V2/SIthickness/c2iceWebPage.sh Fri Apr 9 02:10:59 UTC 2021 on arcmfcval