Validation of ice thickness - Full domain
Bulletin date: 2021-02-11
Model: ARC MFC - TOPAZ
Data source: UCL CryoSAT-2 sea ice thickness
Validation statistics summary
| Bias (m) | RMS (m) | total grids | low SIT | OK SIT | high SIT | |
|---|---|---|---|---|---|---|
| Best estimate | -0.4 | 0.68 | 40131 | 5906 | 34113 | 112 |
| Day 1 forecast | -0.39 | 0.68 | 40131 | 5936 | 34052 | 143 |
| Day 4 forecast | -0.39 | 0.68 | 40131 | 5974 | 34027 | 130 |
| Day 7 forecast | -0.37 | 0.68 | 40131 | 5885 | 34053 | 193 |
| Day 10 forecast | -0.37 | 0.68 | 40131 | 5948 | 34039 | 144 |
Numbers in the three rightmost columns are grid counts. Regions with high/low sea ice thickness correspond to areas with model offsets from the gridded observations outside of one standard deviation. (Standard deviations are provided in the observational product.)
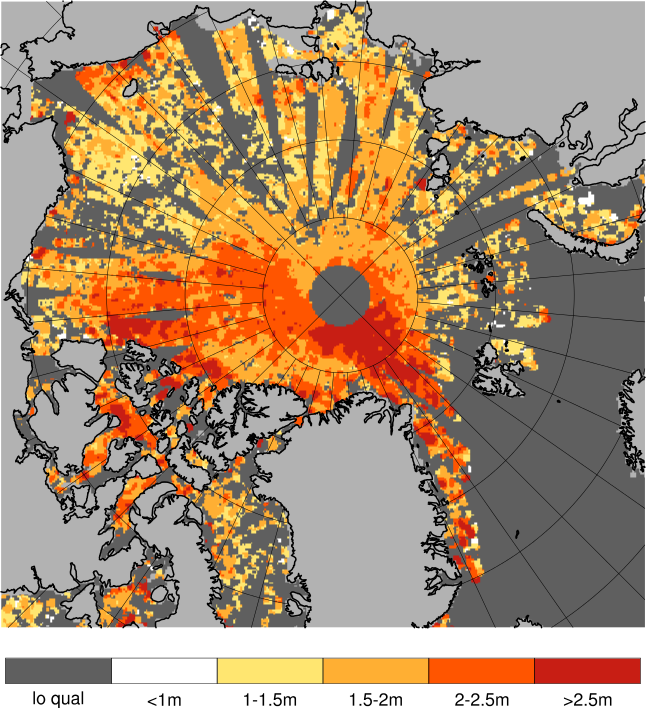
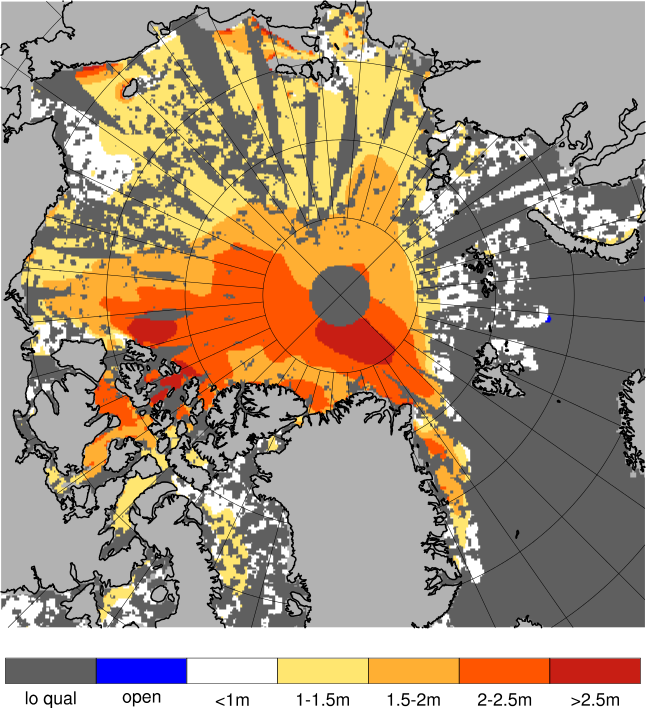
Definition of categories:
| Category | Sea ice thickness |
|---|---|
| c1 | <1m |
| c2 | 1 - 1.5m |
| c3 | 1.5 - 2m |
| c4 | 2 - 2.5m |
| c5 | 2.5 - 3m |
| c6 | >3m |
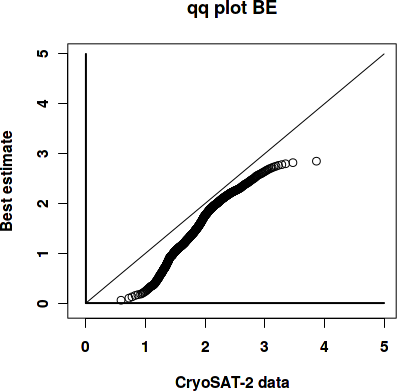
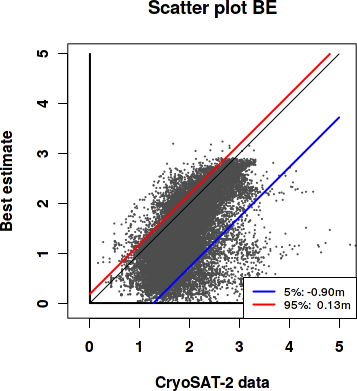
Best estimate vs. observations
Contingency table
| observations | |||||||||
|---|---|---|---|---|---|---|---|---|---|
| open | c1 | c2 | c3 | c4 | c5 | c6 | |||
| m o d e l |
open | 0 | 0 | 0 | 0 | 0 | 0 | 0 | |
| c1 | 0 | 0.009 | 0.094 | 0.08 | 0.02 | 0.005 | 0.004 | ||
| c2 | 0 | 0.003 | 0.125 | 0.189 | 0.032 | 0.006 | 0.003 | ||
| c3 | 0 | 0.001 | 0.008 | 0.137 | 0.073 | 0.006 | 0.001 | ||
| c4 | 0 | 0 | 0.001 | 0.026 | 0.109 | 0.028 | 0.005 | ||
| c5 | 0 | 0 | 0 | 0.001 | 0.007 | 0.022 | 0.005 | ||
| c6 | 0 | 0 | 0 | 0 | 0 | 0 | 0 | ||
See category definitions for details.
Statistical distribution
|
|
Observed sea ice thickness from CryoSAT
Sea ice thickness, best estimate product

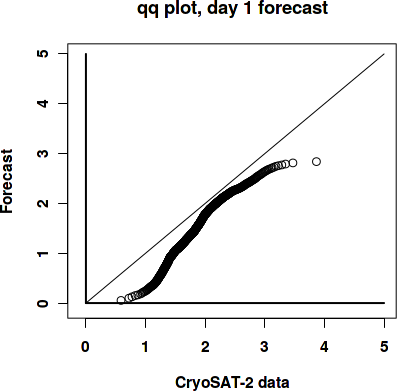
Day 1 forecast vs. observations
Contingency table
| observations | |||||||||
|---|---|---|---|---|---|---|---|---|---|
| open | c1 | c2 | c3 | c4 | c5 | c6 | |||
| m o d e l |
open | 0 | 0 | 0 | 0 | 0 | 0 | 0 | |
| c1 | 0 | 0.008 | 0.09 | 0.081 | 0.021 | 0.005 | 0.004 | ||
| c2 | 0 | 0.003 | 0.126 | 0.18 | 0.031 | 0.006 | 0.003 | ||
| c3 | 0 | 0.001 | 0.01 | 0.141 | 0.07 | 0.007 | 0.001 | ||
| c4 | 0 | 0 | 0.002 | 0.031 | 0.112 | 0.029 | 0.005 | ||
| c5 | 0 | 0 | 0 | 0.001 | 0.006 | 0.02 | 0.004 | ||
| c6 | 0 | 0 | 0 | 0 | 0 | 0 | 0 | ||
See category definitions for details.
Statistical distribution
|
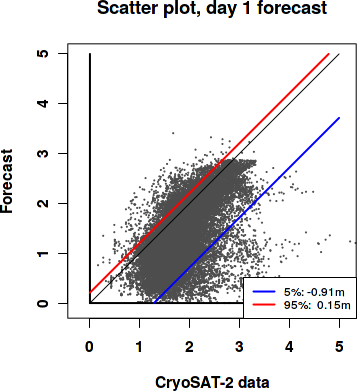
|
Sea ice thickness, day 1 forecast

Day 7 forecast vs. observations
Contingency table
| observations | |||||||||
|---|---|---|---|---|---|---|---|---|---|
| open | c1 | c2 | c3 | c4 | c5 | c6 | |||
| m o d e l |
open | 0 | 0 | 0 | 0 | 0 | 0 | 0 | |
| c1 | 0 | 0.008 | 0.088 | 0.082 | 0.021 | 0.005 | 0.005 | ||
| c2 | 0 | 0.003 | 0.124 | 0.171 | 0.03 | 0.006 | 0.003 | ||
| c3 | 0 | 0.001 | 0.013 | 0.144 | 0.067 | 0.007 | 0.002 | ||
| c4 | 0 | 0 | 0.002 | 0.036 | 0.115 | 0.029 | 0.005 | ||
| c5 | 0 | 0 | 0.001 | 0.001 | 0.007 | 0.02 | 0.005 | ||
| c6 | 0 | 0 | 0 | 0 | 0 | 0 | 0 | ||
See category definitions for details.
Statistical distribution

|
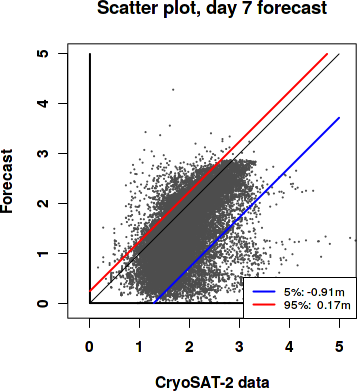
|
Sea ice thickness, day 7 forecast
Generated by /metno/routine/sms/V2/SIthickness/c2iceWebPage.sh Fri Feb 26 02:06:54 UTC 2021 on arcmfcval