Validation of ice thickness - Full domain
Bulletin date: 2021-02-04
Model: ARC MFC - TOPAZ
Data source: UCL CryoSAT-2 sea ice thickness
Validation statistics summary
| Bias (m) | RMS (m) | total grids | low SIT | OK SIT | high SIT | |
|---|---|---|---|---|---|---|
| Best estimate | -0.37 | 0.67 | 38797 | 5338 | 33364 | 95 |
| Day 1 forecast | -0.36 | 0.67 | 38797 | 5416 | 33281 | 100 |
| Day 4 forecast | -0.36 | 0.68 | 38797 | 5486 | 33215 | 96 |
| Day 7 forecast | -0.34 | 0.67 | 38797 | 5311 | 33359 | 127 |
| Day 10 forecast | -0.36 | 0.69 | 38797 | 5789 | 32912 | 96 |
Numbers in the three rightmost columns are grid counts. Regions with high/low sea ice thickness correspond to areas with model offsets from the gridded observations outside of one standard deviation. (Standard deviations are provided in the observational product.)
Definition of categories:
| Category | Sea ice thickness |
|---|---|
| c1 | <1m |
| c2 | 1 - 1.5m |
| c3 | 1.5 - 2m |
| c4 | 2 - 2.5m |
| c5 | 2.5 - 3m |
| c6 | >3m |
Best estimate vs. observations
Contingency table
| observations | |||||||||
|---|---|---|---|---|---|---|---|---|---|
| open | c1 | c2 | c3 | c4 | c5 | c6 | |||
| m o d e l |
open | 0 | 0 | 0 | 0 | 0 | 0 | 0 | |
| c1 | 0 | 0.01 | 0.103 | 0.076 | 0.016 | 0.005 | 0.004 | ||
| c2 | 0 | 0.003 | 0.152 | 0.169 | 0.026 | 0.005 | 0.003 | ||
| c3 | 0 | 0 | 0.009 | 0.142 | 0.062 | 0.007 | 0.002 | ||
| c4 | 0 | 0 | 0.001 | 0.038 | 0.106 | 0.026 | 0.004 | ||
| c5 | 0 | 0 | 0 | 0.002 | 0.008 | 0.015 | 0.006 | ||
| c6 | 0 | 0 | 0 | 0 | 0 | 0 | 0 | ||
See category definitions for details.
Statistical distribution
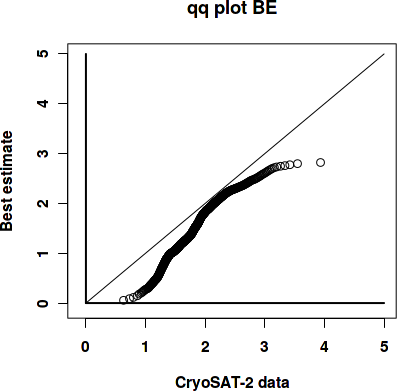
|
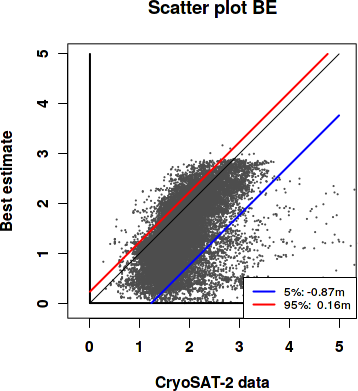
|
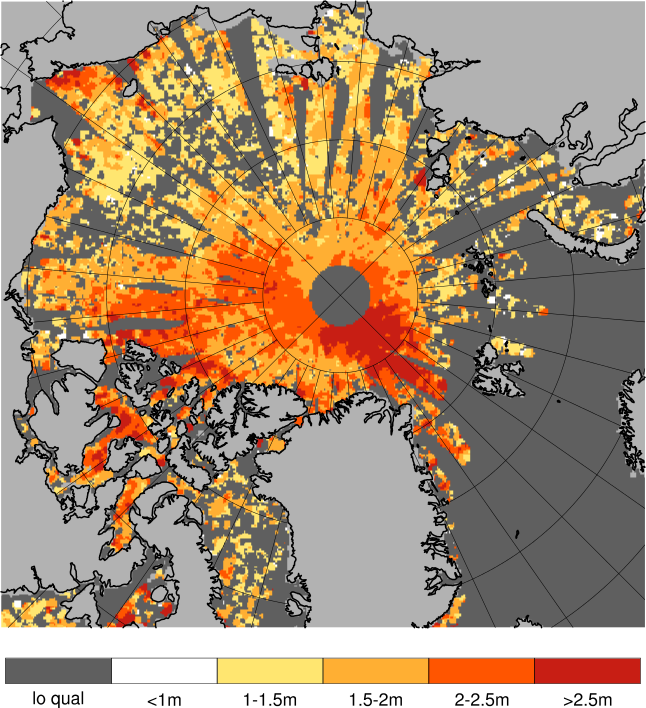
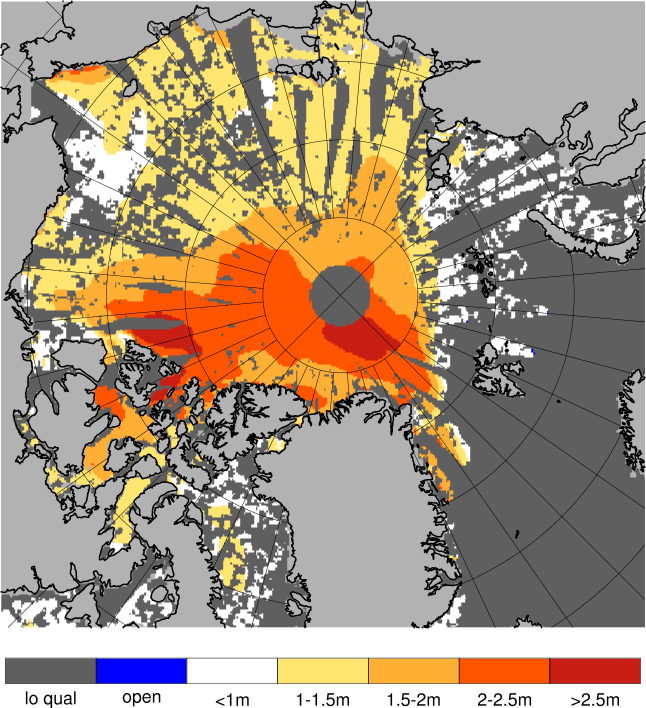
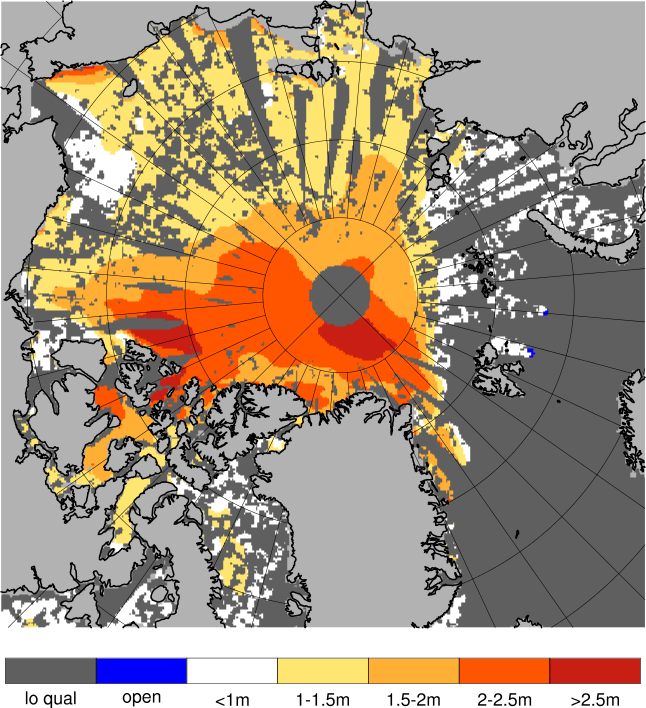
Observed sea ice thickness from CryoSAT
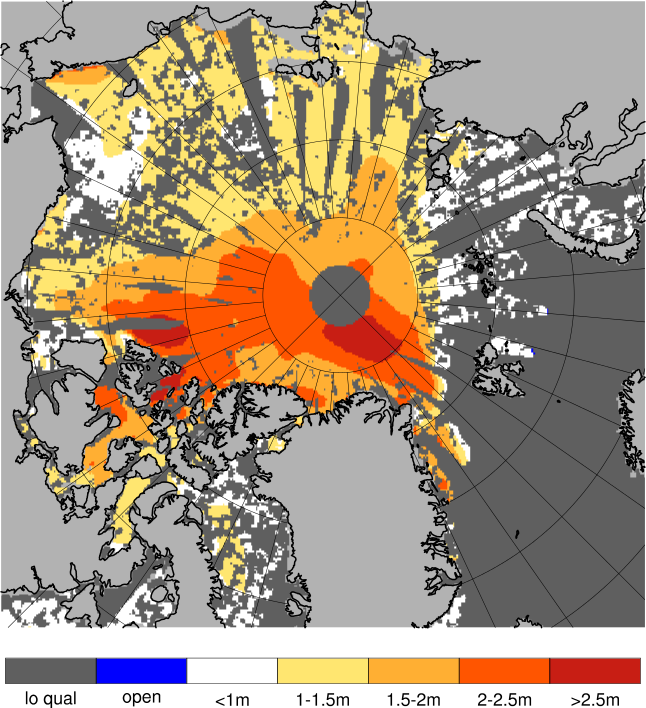
Sea ice thickness, best estimate product
Day 1 forecast vs. observations
Contingency table
| observations | |||||||||
|---|---|---|---|---|---|---|---|---|---|
| open | c1 | c2 | c3 | c4 | c5 | c6 | |||
| m o d e l |
open | 0 | 0 | 0 | 0 | 0 | 0 | 0 | |
| c1 | 0 | 0.01 | 0.099 | 0.076 | 0.016 | 0.005 | 0.004 | ||
| c2 | 0 | 0.004 | 0.154 | 0.164 | 0.026 | 0.006 | 0.003 | ||
| c3 | 0 | 0 | 0.01 | 0.141 | 0.059 | 0.008 | 0.002 | ||
| c4 | 0 | 0 | 0.001 | 0.043 | 0.106 | 0.026 | 0.005 | ||
| c5 | 0 | 0 | 0 | 0.002 | 0.01 | 0.014 | 0.006 | ||
| c6 | 0 | 0 | 0 | 0 | 0 | 0 | 0 | ||
See category definitions for details.
Statistical distribution
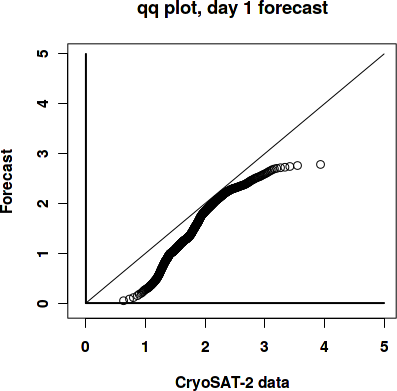
|
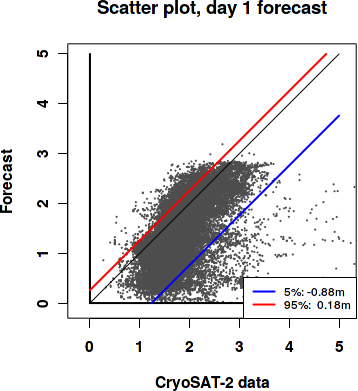
|
Sea ice thickness, day 1 forecast
Day 7 forecast vs. observations
Contingency table
| observations | |||||||||
|---|---|---|---|---|---|---|---|---|---|
| open | c1 | c2 | c3 | c4 | c5 | c6 | |||
| m o d e l |
open | 0 | 0 | 0 | 0 | 0 | 0 | 0 | |
| c1 | 0 | 0.01 | 0.092 | 0.075 | 0.016 | 0.005 | 0.004 | ||
| c2 | 0 | 0.004 | 0.158 | 0.16 | 0.026 | 0.006 | 0.003 | ||
| c3 | 0 | 0 | 0.013 | 0.141 | 0.056 | 0.008 | 0.002 | ||
| c4 | 0 | 0 | 0.002 | 0.048 | 0.107 | 0.025 | 0.006 | ||
| c5 | 0 | 0 | 0 | 0.002 | 0.012 | 0.014 | 0.005 | ||
| c6 | 0 | 0 | 0 | 0 | 0 | 0 | 0 | ||
See category definitions for details.
Statistical distribution

|
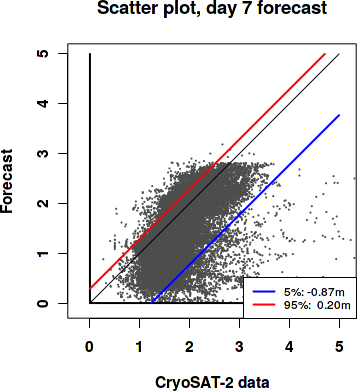
|
Sea ice thickness, day 7 forecast
Generated by /metno/routine/sms/V2/SIthickness/c2iceWebPage.sh Fri Feb 19 01:10:24 UTC 2021 on arcmfcval