Validation of ice thickness - Full domain
Bulletin date: 2021-01-07
Model: ARC MFC - TOPAZ
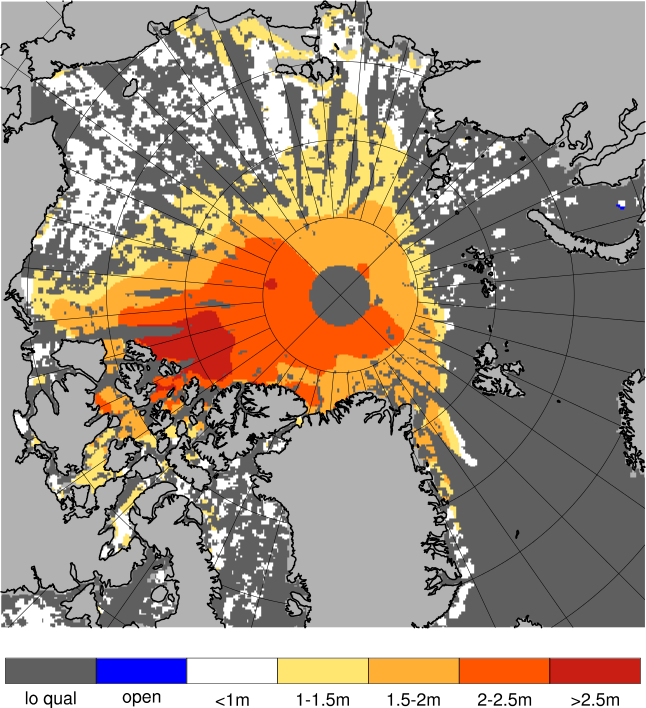
Data source: UCL CryoSAT-2 sea ice thickness
Validation statistics summary
| Bias (m) | RMS (m) | total grids | low SIT | OK SIT | high SIT | |
|---|---|---|---|---|---|---|
| Best estimate | -0.36 | 0.68 | 33898 | 5255 | 28544 | 99 |
| Day 1 forecast | -0.35 | 0.68 | 33898 | 5276 | 28520 | 102 |
| Day 4 forecast | -0.35 | 0.69 | 33898 | 5420 | 28375 | 103 |
| Day 7 forecast | -0.34 | 0.68 | 33898 | 4974 | 28810 | 114 |
| Day 10 forecast | -0.34 | 0.7 | 33898 | 5649 | 28137 | 112 |
Numbers in the three rightmost columns are grid counts. Regions with high/low sea ice thickness correspond to areas with model offsets from the gridded observations outside of one standard deviation. (Standard deviations are provided in the observational product.)
Definition of categories:
| Category | Sea ice thickness |
|---|---|
| c1 | <1m |
| c2 | 1 - 1.5m |
| c3 | 1.5 - 2m |
| c4 | 2 - 2.5m |
| c5 | 2.5 - 3m |
| c6 | >3m |
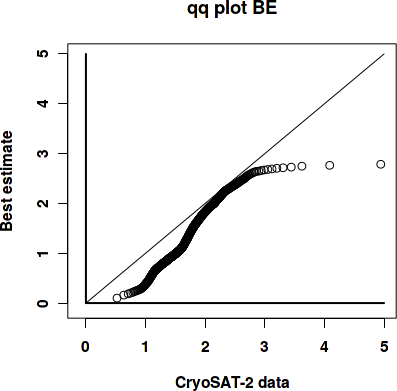
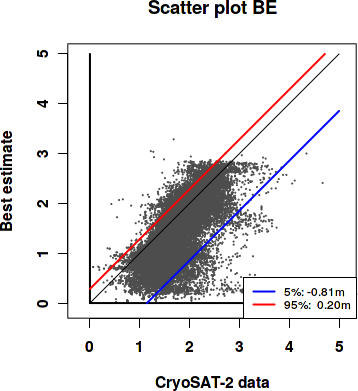
Best estimate vs. observations
Contingency table
| observations | |||||||||
|---|---|---|---|---|---|---|---|---|---|
| open | c1 | c2 | c3 | c4 | c5 | c6 | |||
| m o d e l |
open | 0 | 0 | 0 | 0 | 0 | 0 | 0 | |
| c1 | 0 | 0.029 | 0.208 | 0.09 | 0.015 | 0.002 | 0.007 | ||
| c2 | 0 | 0.002 | 0.088 | 0.097 | 0.015 | 0.002 | 0.001 | ||
| c3 | 0 | 0 | 0.011 | 0.127 | 0.074 | 0.012 | 0.003 | ||
| c4 | 0 | 0 | 0.001 | 0.036 | 0.119 | 0.023 | 0.001 | ||
| c5 | 0 | 0 | 0 | 0.001 | 0.018 | 0.014 | 0.003 | ||
| c6 | 0 | 0 | 0 | 0 | 0 | 0 | 0 | ||
See category definitions for details.
Statistical distribution
|
|
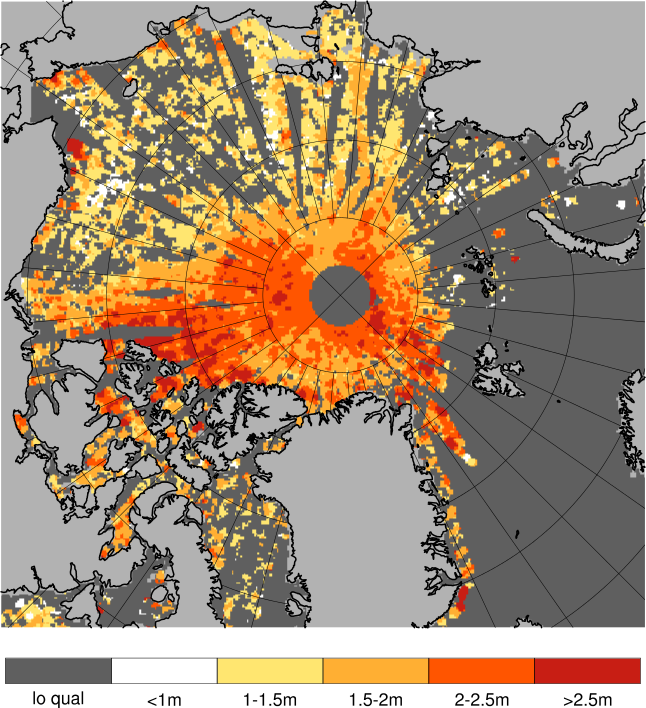
Observed sea ice thickness from CryoSAT
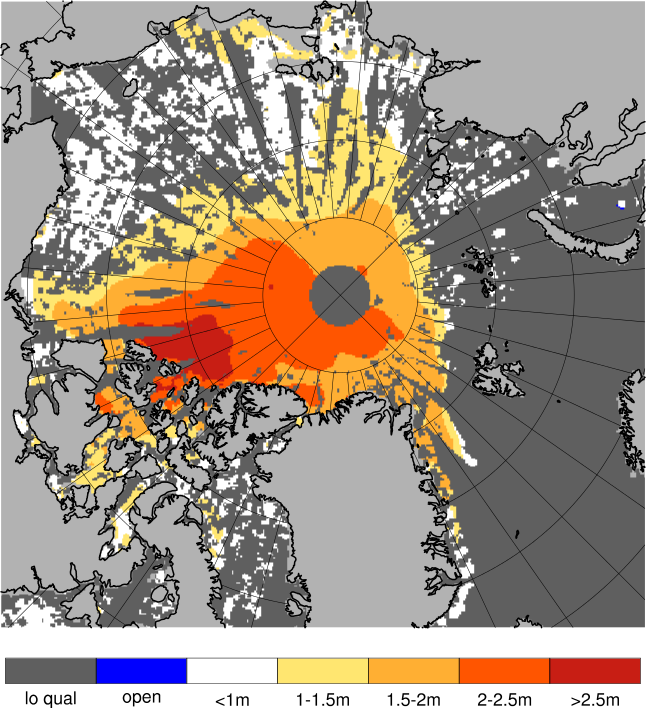
Sea ice thickness, best estimate product
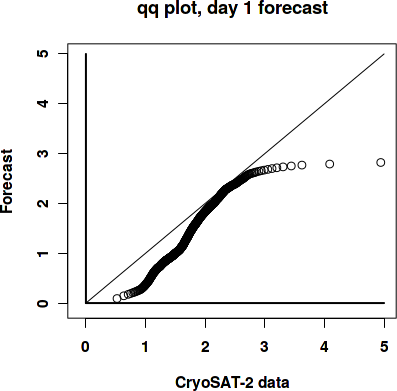
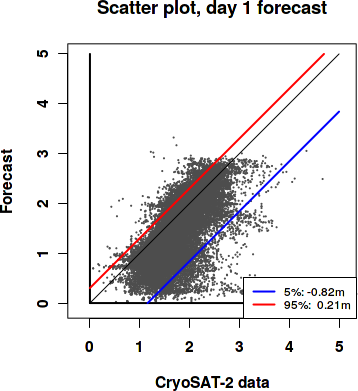
Day 1 forecast vs. observations
Contingency table
| observations | |||||||||
|---|---|---|---|---|---|---|---|---|---|
| open | c1 | c2 | c3 | c4 | c5 | c6 | |||
| m o d e l |
open | 0 | 0 | 0 | 0 | 0 | 0 | 0 | |
| c1 | 0 | 0.027 | 0.2 | 0.089 | 0.016 | 0.002 | 0.007 | ||
| c2 | 0 | 0.003 | 0.096 | 0.095 | 0.015 | 0.002 | 0.001 | ||
| c3 | 0 | 0 | 0.012 | 0.128 | 0.072 | 0.011 | 0.003 | ||
| c4 | 0 | 0 | 0.001 | 0.038 | 0.119 | 0.022 | 0.001 | ||
| c5 | 0 | 0 | 0 | 0.001 | 0.02 | 0.015 | 0.003 | ||
| c6 | 0 | 0 | 0 | 0 | 0 | 0 | 0 | ||
See category definitions for details.
Statistical distribution
|
|
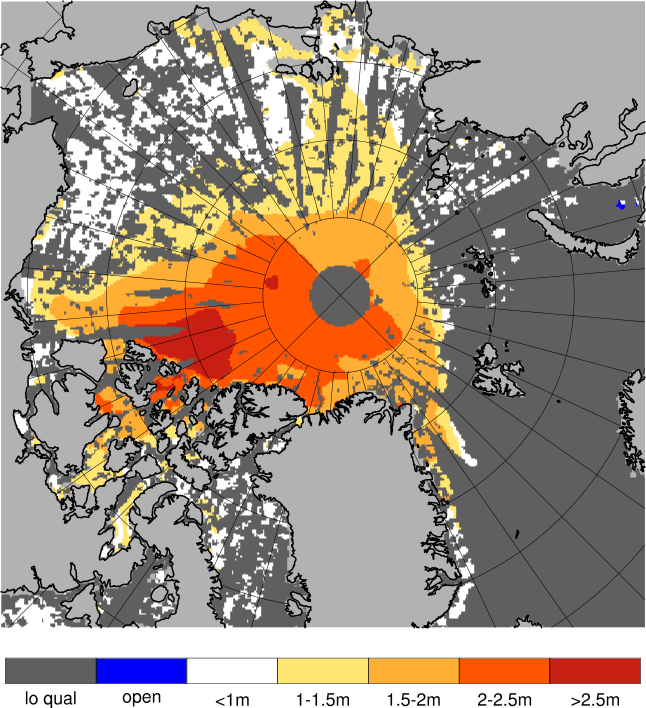
Sea ice thickness, day 1 forecast
Day 7 forecast vs. observations
Contingency table
| observations | |||||||||
|---|---|---|---|---|---|---|---|---|---|
| open | c1 | c2 | c3 | c4 | c5 | c6 | |||
| m o d e l |
open | 0 | 0.001 | 0 | 0 | 0 | 0 | 0 | |
| c1 | 0 | 0.026 | 0.186 | 0.082 | 0.015 | 0.002 | 0.007 | ||
| c2 | 0 | 0.004 | 0.109 | 0.097 | 0.016 | 0.003 | 0.001 | ||
| c3 | 0 | 0 | 0.012 | 0.125 | 0.068 | 0.011 | 0.003 | ||
| c4 | 0 | 0 | 0.002 | 0.045 | 0.121 | 0.023 | 0.002 | ||
| c5 | 0 | 0 | 0 | 0.001 | 0.021 | 0.014 | 0.002 | ||
| c6 | 0 | 0 | 0 | 0 | 0 | 0 | 0 | ||
See category definitions for details.
Statistical distribution

|

|
Sea ice thickness, day 7 forecast
Generated by /metno/routine/sms/V2/SIthickness/c2iceWebPage.sh Fri Jan 22 01:10:08 UTC 2021 on arcmfcval