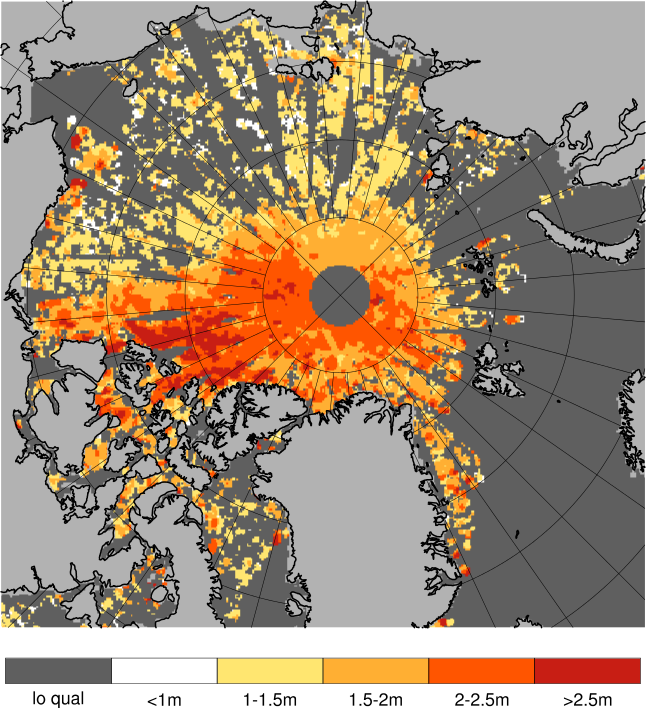
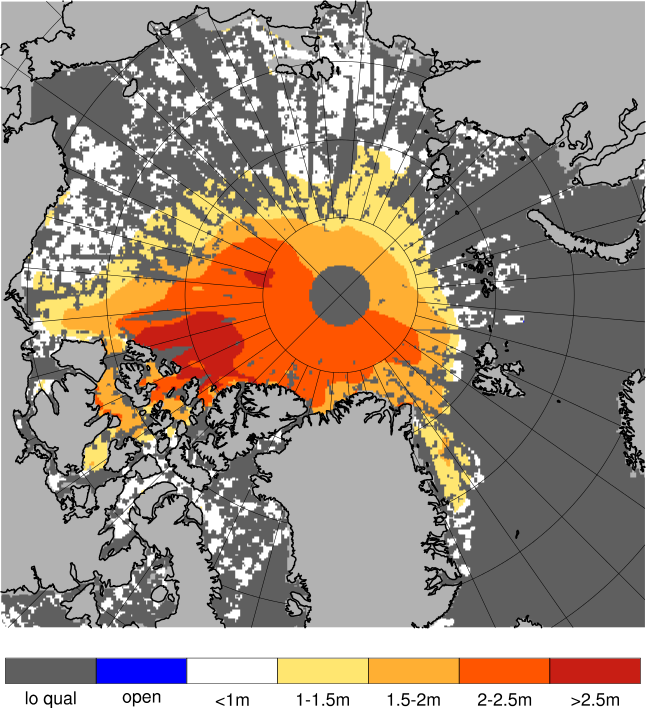
Validation of ice thickness - Full domain
Bulletin date: 2020-12-24
Model: ARC MFC - TOPAZ
Data source: UCL CryoSAT-2 sea ice thickness
Validation statistics summary
| Bias (m) | RMS (m) | total grids | low SIT | OK SIT | high SIT | |
|---|---|---|---|---|---|---|
| Best estimate | -0.3 | 0.66 | 31327 | 5103 | 26084 | 140 |
| Day 1 forecast | -0.3 | 0.66 | 31327 | 5191 | 25992 | 144 |
| Day 4 forecast | -0.31 | 0.67 | 31327 | 5331 | 25849 | 147 |
| Day 7 forecast | -0.29 | 0.65 | 31327 | 5066 | 26113 | 148 |
| Day 10 forecast | -0.36 | 0.69 | 31327 | 5794 | 25430 | 103 |
Numbers in the three rightmost columns are grid counts. Regions with high/low sea ice thickness correspond to areas with model offsets from the gridded observations outside of one standard deviation. (Standard deviations are provided in the observational product.)
Definition of categories:
| Category | Sea ice thickness |
|---|---|
| c1 | <1m |
| c2 | 1 - 1.5m |
| c3 | 1.5 - 2m |
| c4 | 2 - 2.5m |
| c5 | 2.5 - 3m |
| c6 | >3m |
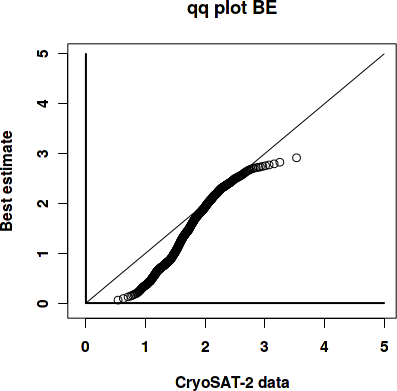
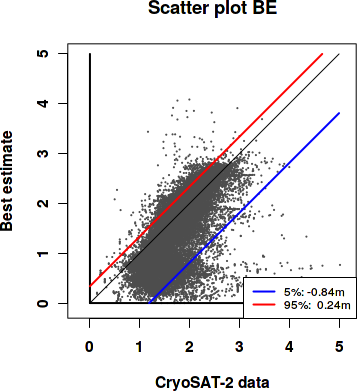
Best estimate vs. observations
Contingency table
| observations | |||||||||
|---|---|---|---|---|---|---|---|---|---|
| open | c1 | c2 | c3 | c4 | c5 | c6 | |||
| m o d e l |
open | 0 | 0 | 0 | 0.001 | 0 | 0 | 0 | |
| c1 | 0 | 0.037 | 0.226 | 0.075 | 0.016 | 0.003 | 0.004 | ||
| c2 | 0 | 0.002 | 0.083 | 0.074 | 0.012 | 0.002 | 0 | ||
| c3 | 0 | 0 | 0.021 | 0.126 | 0.045 | 0.004 | 0.001 | ||
| c4 | 0 | 0 | 0.003 | 0.058 | 0.138 | 0.013 | 0.002 | ||
| c5 | 0 | 0 | 0 | 0.001 | 0.025 | 0.025 | 0.002 | ||
| c6 | 0 | 0 | 0 | 0 | 0.001 | 0 | 0 | ||
See category definitions for details.
Statistical distribution
|
|
Observed sea ice thickness from CryoSAT
Sea ice thickness, best estimate product

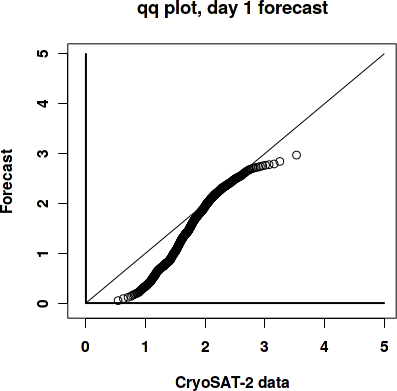
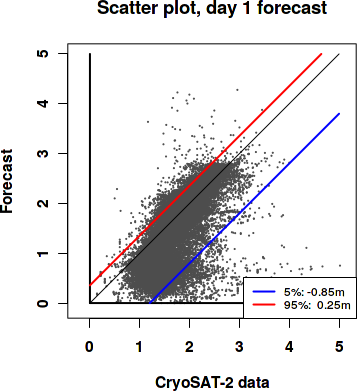
Day 1 forecast vs. observations
Contingency table
| observations | |||||||||
|---|---|---|---|---|---|---|---|---|---|
| open | c1 | c2 | c3 | c4 | c5 | c6 | |||
| m o d e l |
open | 0 | 0 | 0 | 0.001 | 0 | 0 | 0 | |
| c1 | 0 | 0.036 | 0.222 | 0.073 | 0.016 | 0.003 | 0.004 | ||
| c2 | 0 | 0.003 | 0.087 | 0.08 | 0.012 | 0.002 | 0 | ||
| c3 | 0 | 0 | 0.02 | 0.118 | 0.044 | 0.004 | 0.001 | ||
| c4 | 0 | 0 | 0.003 | 0.062 | 0.14 | 0.014 | 0.002 | ||
| c5 | 0 | 0 | 0 | 0.001 | 0.023 | 0.024 | 0.002 | ||
| c6 | 0 | 0 | 0 | 0.001 | 0.001 | 0 | 0 | ||
See category definitions for details.
Statistical distribution
|
|
Sea ice thickness, day 1 forecast
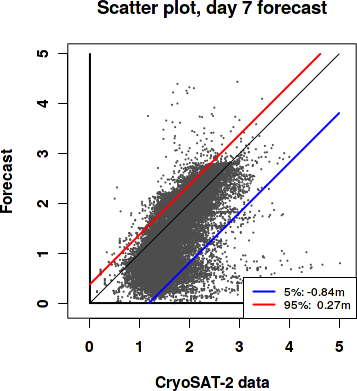
Day 7 forecast vs. observations
Contingency table
| observations | |||||||||
|---|---|---|---|---|---|---|---|---|---|
| open | c1 | c2 | c3 | c4 | c5 | c6 | |||
| m o d e l |
open | 0 | 0 | 0 | 0.001 | 0 | 0 | 0 | |
| c1 | 0 | 0.035 | 0.216 | 0.07 | 0.016 | 0.004 | 0.004 | ||
| c2 | 0 | 0.003 | 0.092 | 0.082 | 0.012 | 0.001 | 0 | ||
| c3 | 0 | 0 | 0.022 | 0.115 | 0.045 | 0.004 | 0.001 | ||
| c4 | 0 | 0 | 0.003 | 0.065 | 0.139 | 0.014 | 0.002 | ||
| c5 | 0 | 0 | 0 | 0.002 | 0.024 | 0.024 | 0.002 | ||
| c6 | 0 | 0 | 0 | 0.001 | 0.001 | 0 | 0.001 | ||
See category definitions for details.
Statistical distribution

|
|
Sea ice thickness, day 7 forecast

Generated by /metno/routine/sms/V2/SIthickness/c2iceWebPage.sh Fri Jan 8 01:11:12 UTC 2021 on arcmfcval