Validation of ice thickness - Full domain
Bulletin date: 2020-12-17
Model: ARC MFC - TOPAZ
Data source: UCL CryoSAT-2 sea ice thickness
Validation statistics summary
| Bias (m) | RMS (m) | total grids | low SIT | OK SIT | high SIT | |
|---|---|---|---|---|---|---|
| Best estimate | -0.36 | 0.69 | 30905 | 5433 | 25401 | 71 |
| Day 1 forecast | -0.38 | 0.7 | 30905 | 5615 | 25221 | 69 |
| Day 4 forecast | -0.39 | 0.7 | 30905 | 5842 | 24995 | 68 |
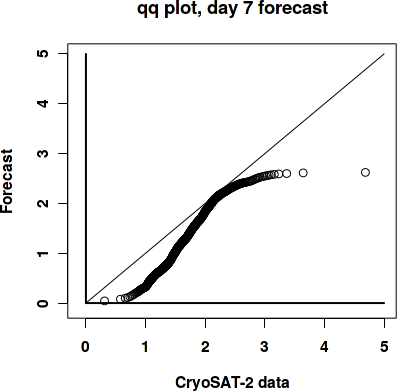
| Day 7 forecast | -0.38 | 0.69 | 30905 | 5417 | 25420 | 68 |
| Day 10 forecast | -0.46 | 0.74 | 30905 | 6624 | 24218 | 63 |
Numbers in the three rightmost columns are grid counts. Regions with high/low sea ice thickness correspond to areas with model offsets from the gridded observations outside of one standard deviation. (Standard deviations are provided in the observational product.)
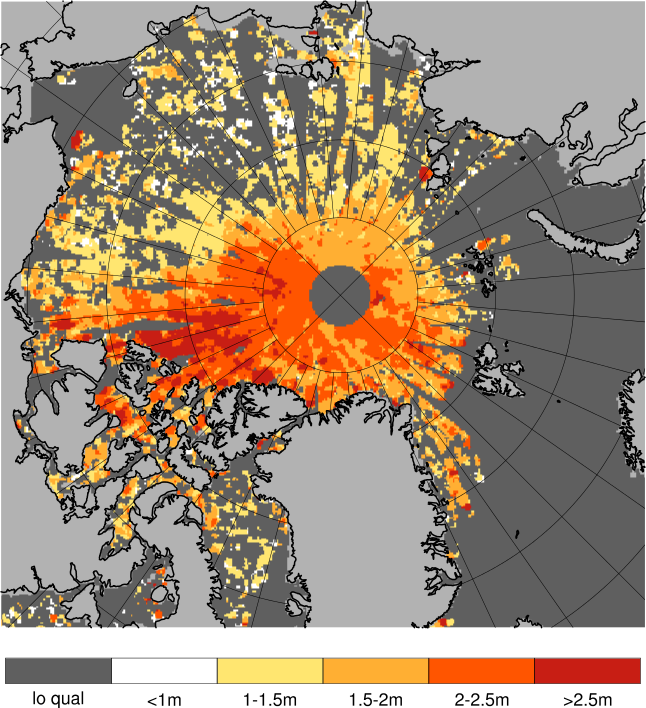
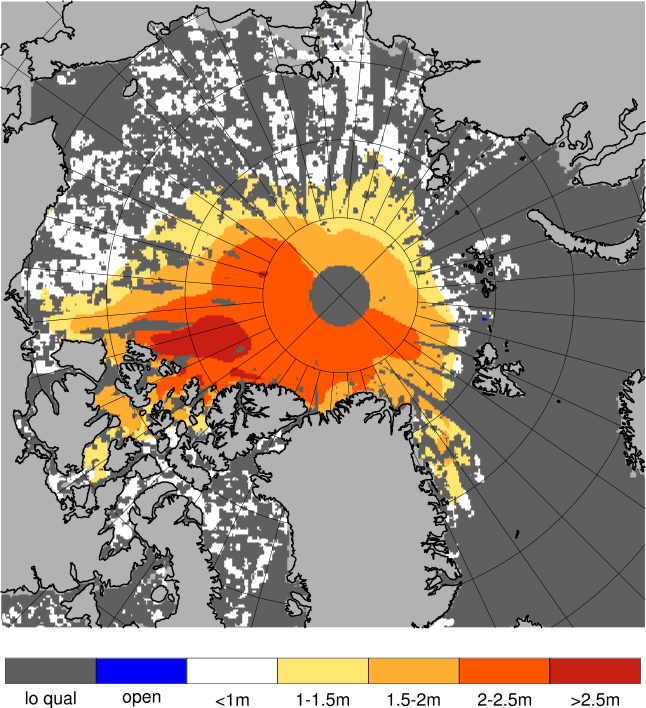
Definition of categories:
| Category | Sea ice thickness |
|---|---|
| c1 | <1m |
| c2 | 1 - 1.5m |
| c3 | 1.5 - 2m |
| c4 | 2 - 2.5m |
| c5 | 2.5 - 3m |
| c6 | >3m |
Best estimate vs. observations
Contingency table
| observations | |||||||||
|---|---|---|---|---|---|---|---|---|---|
| open | c1 | c2 | c3 | c4 | c5 | c6 | |||
| m o d e l |
open | 0 | 0 | 0 | 0 | 0 | 0 | 0 | |
| c1 | 0 | 0.045 | 0.221 | 0.074 | 0.014 | 0.002 | 0.003 | ||
| c2 | 0 | 0.001 | 0.081 | 0.083 | 0.013 | 0.003 | 0.001 | ||
| c3 | 0 | 0 | 0.014 | 0.119 | 0.058 | 0.006 | 0.001 | ||
| c4 | 0 | 0 | 0.001 | 0.044 | 0.154 | 0.022 | 0.003 | ||
| c5 | 0 | 0 | 0 | 0.001 | 0.012 | 0.018 | 0.006 | ||
| c6 | 0 | 0 | 0 | 0 | 0 | 0 | 0 | ||
See category definitions for details.
Statistical distribution
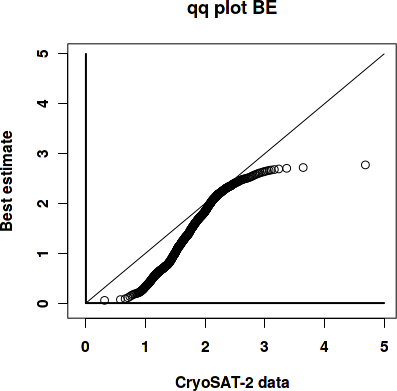
|
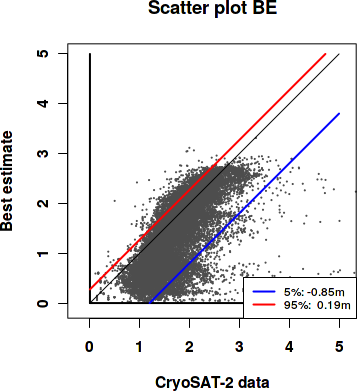
|
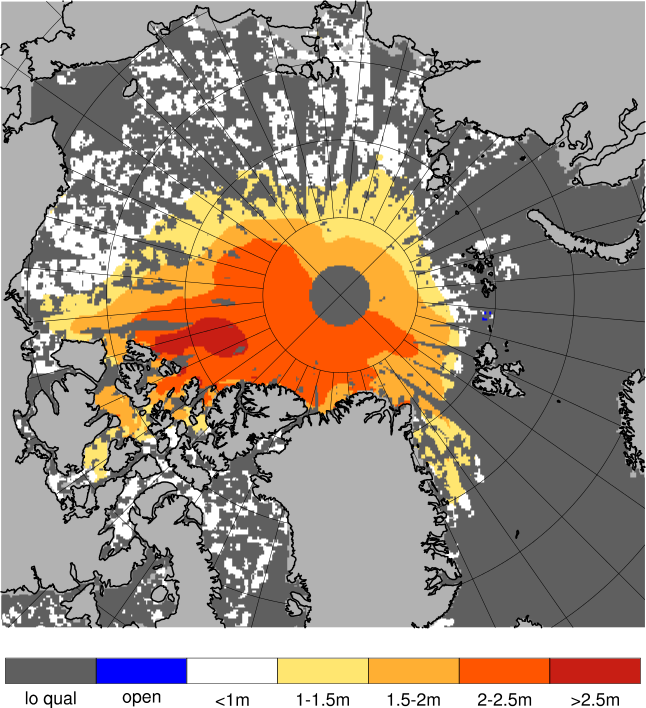
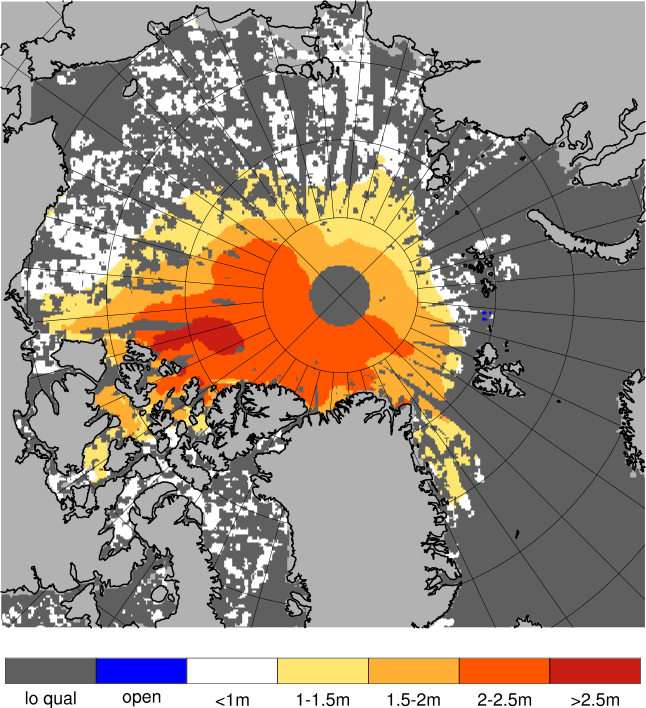
Observed sea ice thickness from CryoSAT
Sea ice thickness, best estimate product
Day 1 forecast vs. observations
Contingency table
| observations | |||||||||
|---|---|---|---|---|---|---|---|---|---|
| open | c1 | c2 | c3 | c4 | c5 | c6 | |||
| m o d e l |
open | 0 | 0 | 0 | 0 | 0 | 0 | 0 | |
| c1 | 0 | 0.045 | 0.222 | 0.074 | 0.014 | 0.002 | 0.003 | ||
| c2 | 0 | 0.001 | 0.081 | 0.091 | 0.014 | 0.003 | 0.001 | ||
| c3 | 0 | 0 | 0.013 | 0.112 | 0.063 | 0.006 | 0.002 | ||
| c4 | 0 | 0 | 0.001 | 0.042 | 0.154 | 0.024 | 0.005 | ||
| c5 | 0 | 0 | 0 | 0.001 | 0.007 | 0.015 | 0.004 | ||
| c6 | 0 | 0 | 0 | 0 | 0 | 0 | 0 | ||
See category definitions for details.
Statistical distribution
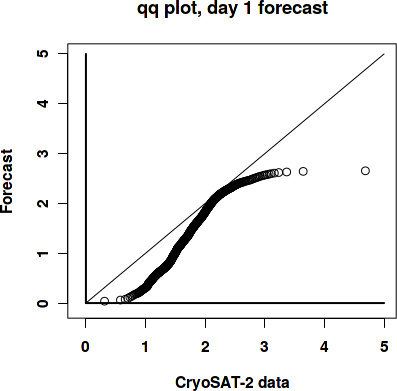
|

|
Sea ice thickness, day 1 forecast
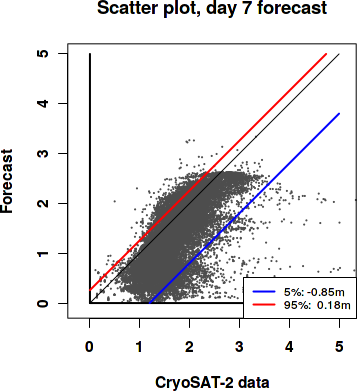
Day 7 forecast vs. observations
Contingency table
| observations | |||||||||
|---|---|---|---|---|---|---|---|---|---|
| open | c1 | c2 | c3 | c4 | c5 | c6 | |||
| m o d e l |
open | 0 | 0 | 0 | 0 | 0 | 0 | 0 | |
| c1 | 0 | 0.045 | 0.218 | 0.072 | 0.013 | 0.002 | 0.003 | ||
| c2 | 0 | 0.001 | 0.083 | 0.097 | 0.015 | 0.003 | 0.001 | ||
| c3 | 0 | 0 | 0.015 | 0.108 | 0.065 | 0.006 | 0.002 | ||
| c4 | 0 | 0 | 0.001 | 0.043 | 0.152 | 0.026 | 0.006 | ||
| c5 | 0 | 0 | 0 | 0.001 | 0.006 | 0.014 | 0.003 | ||
| c6 | 0 | 0 | 0 | 0 | 0 | 0 | 0 | ||
See category definitions for details.
Statistical distribution
|
|
Sea ice thickness, day 7 forecast
Generated by /metno/routine/sms/V2/SIthickness/c2iceWebPage.sh Fri Jan 1 01:11:10 UTC 2021 on arcmfcval