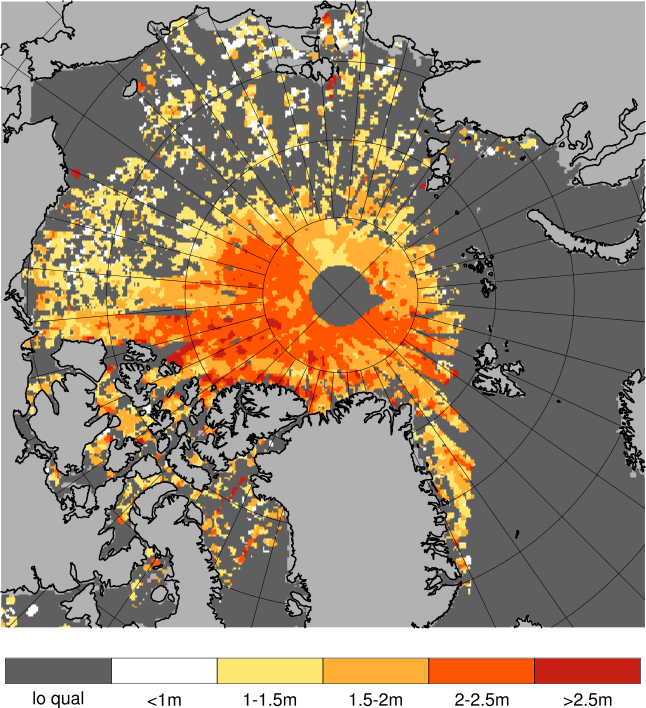
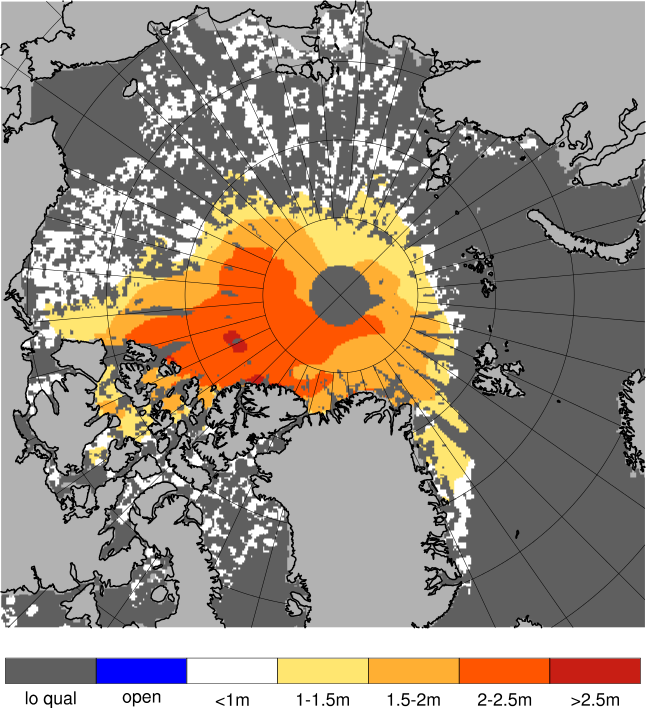
Validation of ice thickness - Full domain
Bulletin date: 2020-12-03
Model: ARC MFC - TOPAZ
Data source: UCL CryoSAT-2 sea ice thickness
Validation statistics summary
| Bias (m) | RMS (m) | total grids | low SIT | OK SIT | high SIT | |
|---|---|---|---|---|---|---|
| Best estimate | -0.37 | 0.7 | 27127 | 5782 | 21253 | 92 |
| Day 1 forecast | -0.39 | 0.71 | 27127 | 6026 | 21009 | 92 |
| Day 4 forecast | -0.4 | 0.72 | 27127 | 6209 | 20828 | 90 |
| Day 7 forecast | -0.39 | 0.71 | 27127 | 5884 | 21143 | 100 |
| Day 10 forecast | -0.48 | 0.76 | 27127 | 7087 | 19963 | 77 |
Numbers in the three rightmost columns are grid counts. Regions with high/low sea ice thickness correspond to areas with model offsets from the gridded observations outside of one standard deviation. (Standard deviations are provided in the observational product.)
Definition of categories:
| Category | Sea ice thickness |
|---|---|
| c1 | <1m |
| c2 | 1 - 1.5m |
| c3 | 1.5 - 2m |
| c4 | 2 - 2.5m |
| c5 | 2.5 - 3m |
| c6 | >3m |
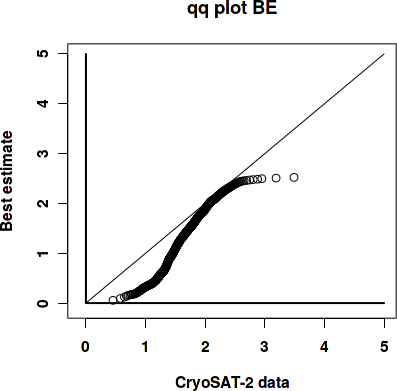
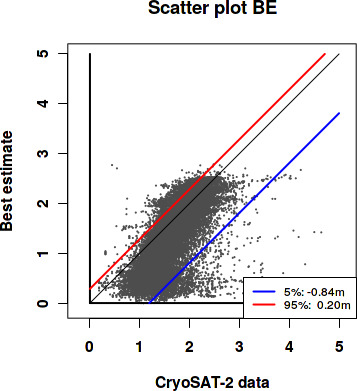
Best estimate vs. observations
Contingency table
| observations | |||||||||
|---|---|---|---|---|---|---|---|---|---|
| open | c1 | c2 | c3 | c4 | c5 | c6 | |||
| m o d e l |
open | 0 | 0 | 0.001 | 0 | 0 | 0 | 0 | |
| c1 | 0 | 0.062 | 0.222 | 0.066 | 0.011 | 0.003 | 0.003 | ||
| c2 | 0 | 0.002 | 0.09 | 0.099 | 0.01 | 0.001 | 0 | ||
| c3 | 0 | 0.001 | 0.019 | 0.125 | 0.07 | 0.003 | 0 | ||
| c4 | 0 | 0 | 0.003 | 0.046 | 0.139 | 0.015 | 0.002 | ||
| c5 | 0 | 0 | 0 | 0 | 0.003 | 0.002 | 0.001 | ||
| c6 | 0 | 0 | 0 | 0 | 0 | 0 | 0 | ||
See category definitions for details.
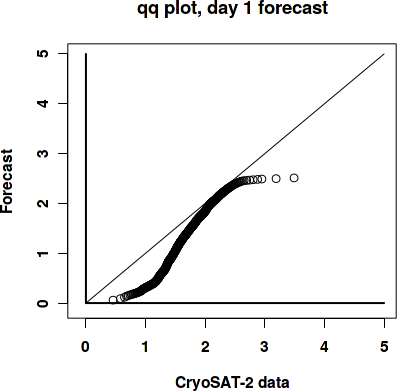
Statistical distribution
|
|
Observed sea ice thickness from CryoSAT
Sea ice thickness, best estimate product
Day 1 forecast vs. observations
Contingency table
| observations | |||||||||
|---|---|---|---|---|---|---|---|---|---|
| open | c1 | c2 | c3 | c4 | c5 | c6 | |||
| m o d e l |
open | 0 | 0 | 0.001 | 0 | 0 | 0 | 0 | |
| c1 | 0 | 0.063 | 0.228 | 0.073 | 0.012 | 0.003 | 0.003 | ||
| c2 | 0 | 0.002 | 0.087 | 0.098 | 0.012 | 0.001 | 0 | ||
| c3 | 0 | 0.001 | 0.016 | 0.119 | 0.086 | 0.003 | 0 | ||
| c4 | 0 | 0 | 0.003 | 0.045 | 0.122 | 0.016 | 0.001 | ||
| c5 | 0 | 0 | 0 | 0 | 0.002 | 0.001 | 0.001 | ||
| c6 | 0 | 0 | 0 | 0 | 0 | 0 | 0 | ||
See category definitions for details.
Statistical distribution
|

|
Sea ice thickness, day 1 forecast
Day 7 forecast vs. observations
Contingency table
| observations | |||||||||
|---|---|---|---|---|---|---|---|---|---|
| open | c1 | c2 | c3 | c4 | c5 | c6 | |||
| m o d e l |
open | 0 | 0 | 0.001 | 0 | 0 | 0 | 0 | |
| c1 | 0 | 0.062 | 0.229 | 0.076 | 0.012 | 0.003 | 0.003 | ||
| c2 | 0 | 0.002 | 0.087 | 0.098 | 0.013 | 0.001 | 0.001 | ||
| c3 | 0 | 0.001 | 0.015 | 0.114 | 0.089 | 0.003 | 0 | ||
| c4 | 0 | 0 | 0.004 | 0.048 | 0.119 | 0.016 | 0.001 | ||
| c5 | 0 | 0 | 0 | 0 | 0.002 | 0.001 | 0.001 | ||
| c6 | 0 | 0 | 0 | 0 | 0 | 0 | 0 | ||
See category definitions for details.
Statistical distribution

|
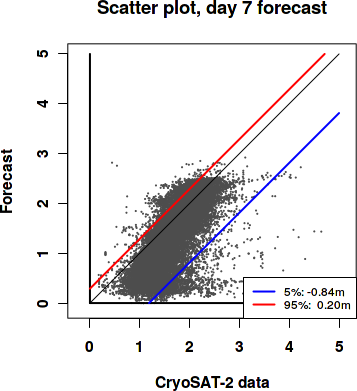
|
Sea ice thickness, day 7 forecast

Generated by /metno/routine/sms/V2/SIthickness/c2iceWebPage.sh Fri Dec 18 11:45:39 UTC 2020 on arcmfcval