Validation of ice thickness - Full domain
Bulletin date: 2020-11-19
Model: ARC MFC - TOPAZ
Data source: UCL CryoSAT-2 sea ice thickness
Validation statistics summary
| Bias (m) | RMS (m) | total grids | low SIT | OK SIT | high SIT | |
|---|---|---|---|---|---|---|
| Best estimate | -0.47 | 0.87 | 23821 | 6610 | 17140 | 71 |
| Day 1 forecast | -0.48 | 0.88 | 23821 | 6862 | 16892 | 67 |
| Day 4 forecast | -0.49 | 0.88 | 23821 | 7009 | 16748 | 64 |
| Day 7 forecast | -0.48 | 0.87 | 23821 | 6697 | 17058 | 66 |
| Day 10 forecast | -0.7 | 0.98 | 23821 | 8803 | 14989 | 29 |
Numbers in the three rightmost columns are grid counts. Regions with high/low sea ice thickness correspond to areas with model offsets from the gridded observations outside of one standard deviation. (Standard deviations are provided in the observational product.)
Definition of categories:
| Category | Sea ice thickness |
|---|---|
| c1 | <1m |
| c2 | 1 - 1.5m |
| c3 | 1.5 - 2m |
| c4 | 2 - 2.5m |
| c5 | 2.5 - 3m |
| c6 | >3m |
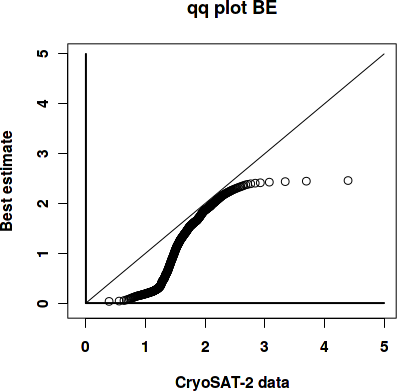
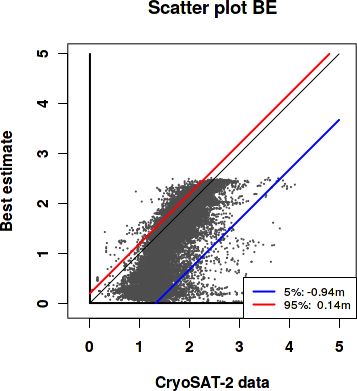
Best estimate vs. observations
Contingency table
| observations | |||||||||
|---|---|---|---|---|---|---|---|---|---|
| open | c1 | c2 | c3 | c4 | c5 | c6 | |||
| m o d e l |
open | 0 | 0 | 0 | 0 | 0 | 0 | 0 | |
| c1 | 0 | 0.069 | 0.243 | 0.066 | 0.012 | 0.003 | 0.007 | ||
| c2 | 0 | 0.002 | 0.084 | 0.095 | 0.01 | 0.002 | 0.001 | ||
| c3 | 0 | 0 | 0.019 | 0.188 | 0.064 | 0.003 | 0 | ||
| c4 | 0 | 0 | 0.001 | 0.03 | 0.082 | 0.017 | 0.002 | ||
| c5 | 0 | 0 | 0 | 0 | 0 | 0 | 0 | ||
| c6 | 0 | 0 | 0 | 0 | 0 | 0 | 0 | ||
See category definitions for details.
Statistical distribution
|
|
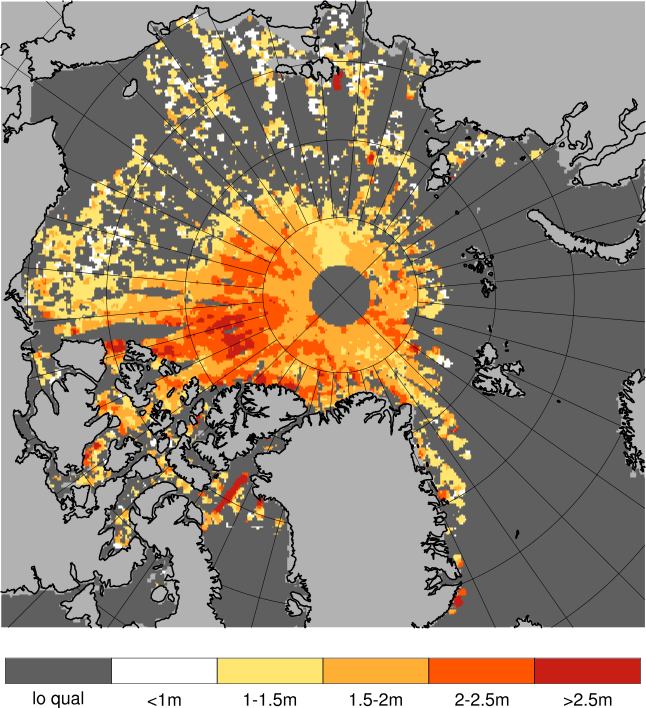
Observed sea ice thickness from CryoSAT
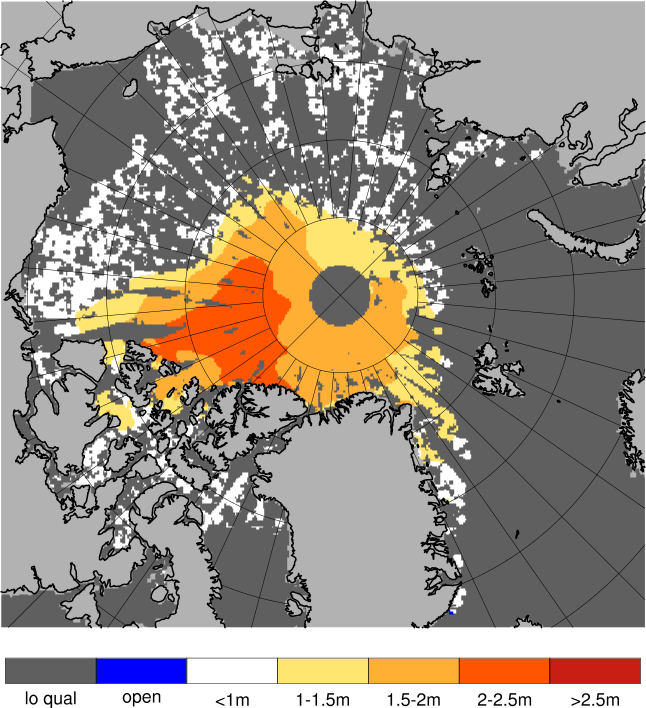
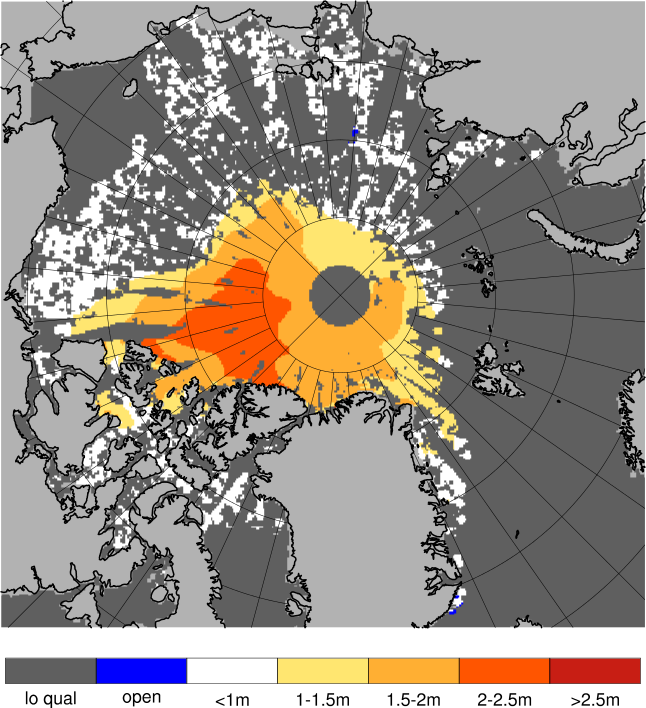
Sea ice thickness, best estimate product
Day 1 forecast vs. observations
Contingency table
| observations | |||||||||
|---|---|---|---|---|---|---|---|---|---|
| open | c1 | c2 | c3 | c4 | c5 | c6 | |||
| m o d e l |
open | 0 | 0 | 0 | 0 | 0 | 0 | 0 | |
| c1 | 0 | 0.069 | 0.244 | 0.068 | 0.012 | 0.003 | 0.007 | ||
| c2 | 0 | 0.002 | 0.083 | 0.098 | 0.011 | 0.002 | 0.001 | ||
| c3 | 0 | 0 | 0.018 | 0.184 | 0.069 | 0.004 | 0 | ||
| c4 | 0 | 0 | 0.001 | 0.028 | 0.076 | 0.015 | 0.002 | ||
| c5 | 0 | 0 | 0 | 0 | 0 | 0.001 | 0 | ||
| c6 | 0 | 0 | 0 | 0 | 0 | 0 | 0 | ||
See category definitions for details.
Statistical distribution
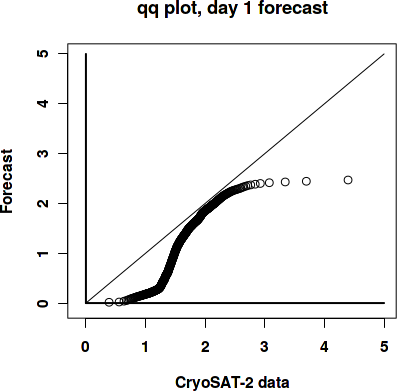
|
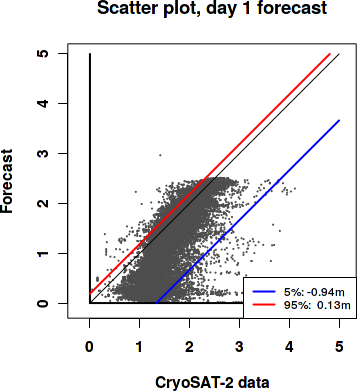
|
Sea ice thickness, day 1 forecast

Day 7 forecast vs. observations
Contingency table
| observations | |||||||||
|---|---|---|---|---|---|---|---|---|---|
| open | c1 | c2 | c3 | c4 | c5 | c6 | |||
| m o d e l |
open | 0 | 0 | 0 | 0 | 0 | 0 | 0 | |
| c1 | 0 | 0.069 | 0.244 | 0.068 | 0.012 | 0.003 | 0.007 | ||
| c2 | 0 | 0.001 | 0.083 | 0.1 | 0.013 | 0.003 | 0.001 | ||
| c3 | 0 | 0 | 0.019 | 0.184 | 0.068 | 0.004 | 0 | ||
| c4 | 0 | 0 | 0.001 | 0.027 | 0.075 | 0.016 | 0.002 | ||
| c5 | 0 | 0 | 0 | 0 | 0 | 0 | 0 | ||
| c6 | 0 | 0 | 0 | 0 | 0 | 0 | 0 | ||
See category definitions for details.
Statistical distribution
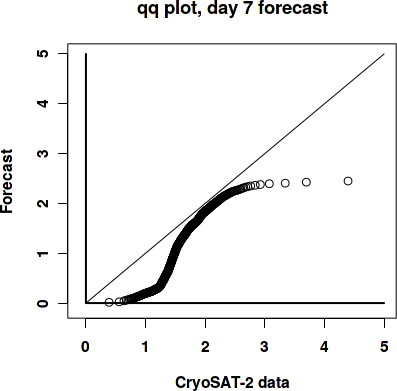
|
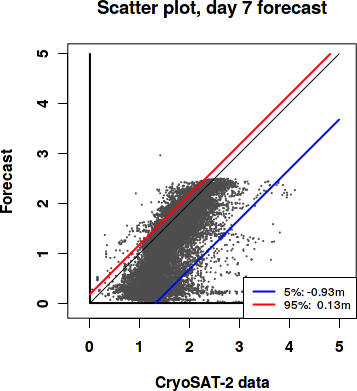
|
Sea ice thickness, day 7 forecast
Generated by /metno/routine/sms/V2/SIthickness/c2iceWebPage.sh Fri Dec 4 01:11:15 UTC 2020 on arcmfcval