Validation of ice thickness - Full domain
Bulletin date: 2020-11-05
Model: ARC MFC - TOPAZ
Data source: UCL CryoSAT-2 sea ice thickness
Validation statistics summary
| Bias (m) | RMS (m) | total grids | low SIT | OK SIT | high SIT | |
|---|---|---|---|---|---|---|
| Best estimate | -0.57 | 0.72 | 19158 | 5832 | 13296 | 30 |
| Day 1 forecast | -0.67 | 0.81 | 19158 | 8033 | 11089 | 36 |
| Day 4 forecast | -0.72 | 0.85 | 19158 | 9097 | 10023 | 38 |
| Day 7 forecast | -0.7 | 0.83 | 19158 | 8670 | 10453 | 35 |
| Day 10 forecast | -0.72 | 0.86 | 19158 | 9142 | 9986 | 30 |
Numbers in the three rightmost columns are grid counts. Regions with high/low sea ice thickness correspond to areas with model offsets from the gridded observations outside of one standard deviation. (Standard deviations are provided in the observational product.)
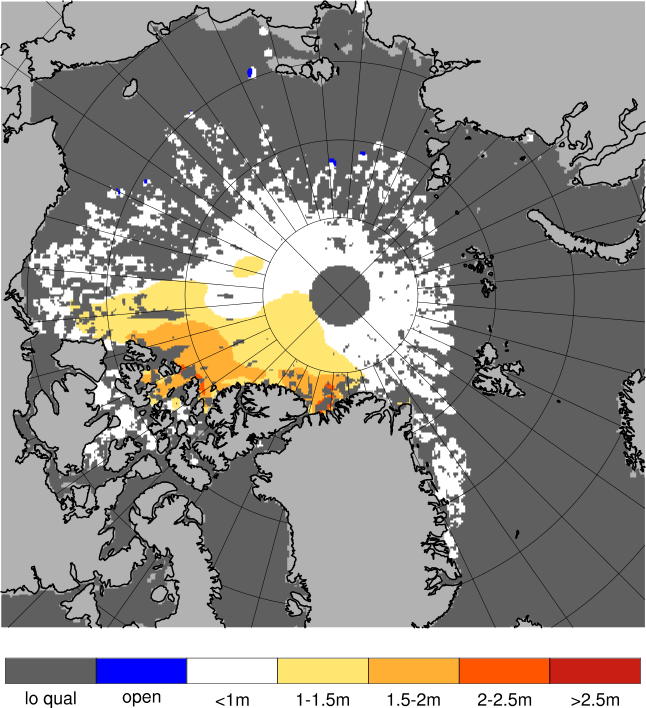
Definition of categories:
| Category | Sea ice thickness |
|---|---|
| c1 | <1m |
| c2 | 1 - 1.5m |
| c3 | 1.5 - 2m |
| c4 | 2 - 2.5m |
| c5 | 2.5 - 3m |
| c6 | >3m |
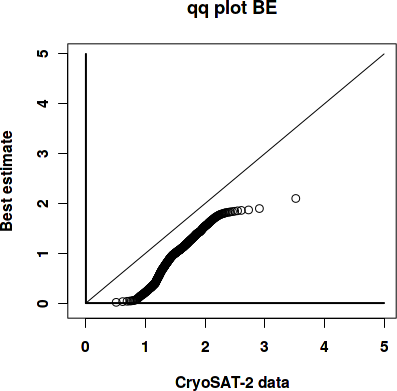
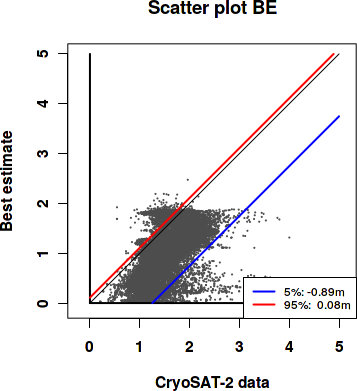
Best estimate vs. observations
Contingency table
| observations | |||||||||
|---|---|---|---|---|---|---|---|---|---|
| open | c1 | c2 | c3 | c4 | c5 | c6 | |||
| m o d e l |
open | 0 | 0.001 | 0 | 0.001 | 0 | 0 | 0 | |
| c1 | 0 | 0.069 | 0.319 | 0.099 | 0.015 | 0.003 | 0.001 | ||
| c2 | 0 | 0.002 | 0.089 | 0.191 | 0.059 | 0.002 | 0 | ||
| c3 | 0 | 0.001 | 0.031 | 0.066 | 0.044 | 0.005 | 0.001 | ||
| c4 | 0 | 0 | 0 | 0 | 0 | 0 | 0 | ||
| c5 | 0 | 0 | 0 | 0 | 0 | 0 | 0 | ||
| c6 | 0 | 0 | 0 | 0 | 0 | 0 | 0 | ||
See category definitions for details.
Statistical distribution
|
|
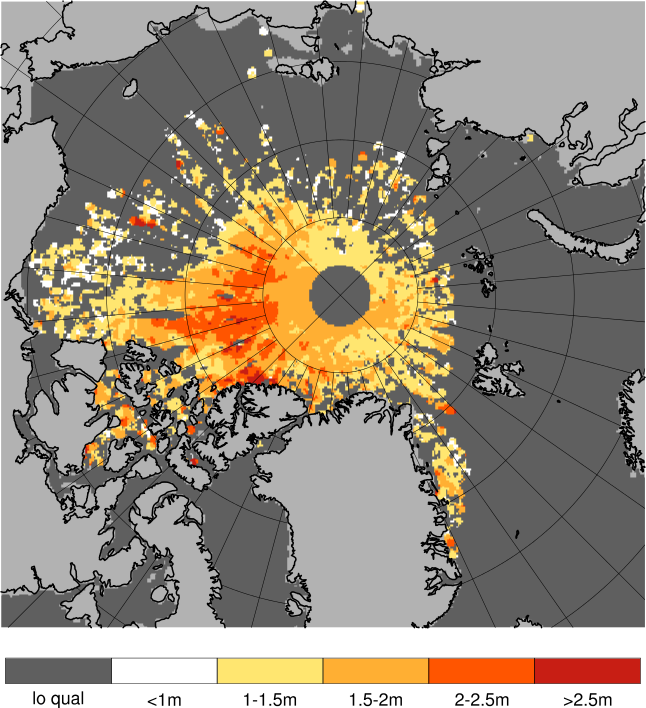
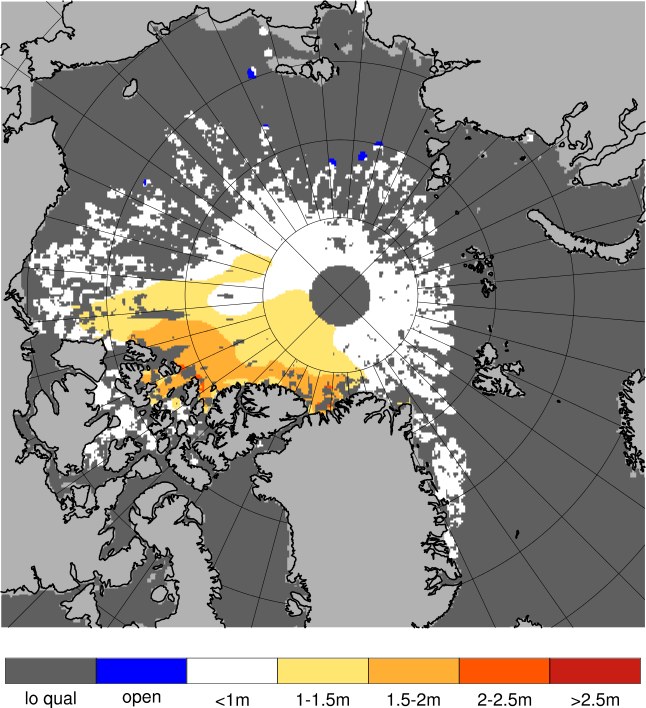
Observed sea ice thickness from CryoSAT
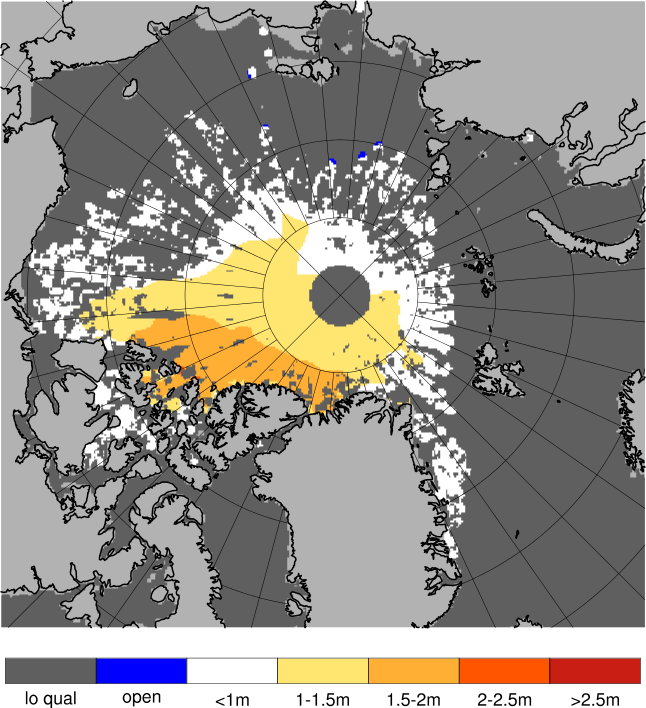
Sea ice thickness, best estimate product
Day 1 forecast vs. observations
Contingency table
| observations | |||||||||
|---|---|---|---|---|---|---|---|---|---|
| open | c1 | c2 | c3 | c4 | c5 | c6 | |||
| m o d e l |
open | 0 | 0.001 | 0.001 | 0.002 | 0 | 0 | 0 | |
| c1 | 0 | 0.069 | 0.364 | 0.179 | 0.041 | 0.004 | 0.001 | ||
| c2 | 0 | 0.002 | 0.045 | 0.126 | 0.053 | 0.004 | 0.001 | ||
| c3 | 0 | 0.001 | 0.028 | 0.05 | 0.025 | 0.003 | 0.001 | ||
| c4 | 0 | 0 | 0.001 | 0.001 | 0 | 0 | 0 | ||
| c5 | 0 | 0 | 0 | 0 | 0 | 0 | 0 | ||
| c6 | 0 | 0 | 0 | 0 | 0 | 0 | 0 | ||
See category definitions for details.
Statistical distribution
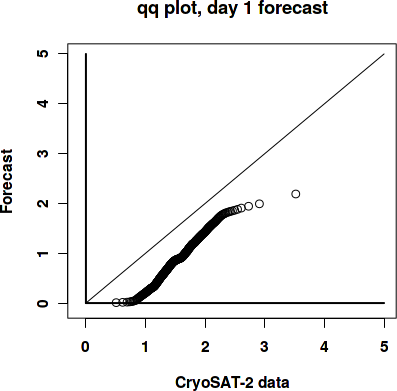
|
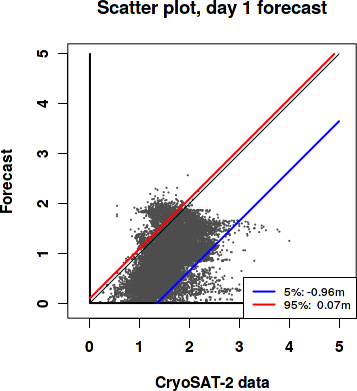
|
Sea ice thickness, day 1 forecast
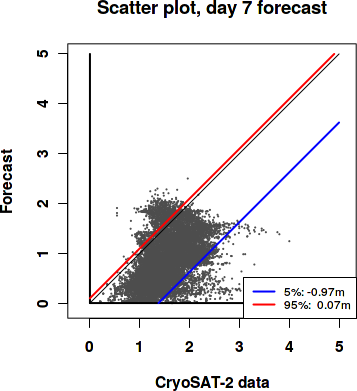
Day 7 forecast vs. observations
Contingency table
| observations | |||||||||
|---|---|---|---|---|---|---|---|---|---|
| open | c1 | c2 | c3 | c4 | c5 | c6 | |||
| m o d e l |
open | 0 | 0 | 0 | 0.001 | 0 | 0 | 0 | |
| c1 | 0 | 0.07 | 0.364 | 0.194 | 0.049 | 0.004 | 0.001 | ||
| c2 | 0 | 0.002 | 0.046 | 0.116 | 0.048 | 0.003 | 0.001 | ||
| c3 | 0 | 0.001 | 0.026 | 0.045 | 0.021 | 0.003 | 0 | ||
| c4 | 0 | 0 | 0.002 | 0.002 | 0 | 0 | 0 | ||
| c5 | 0 | 0 | 0 | 0 | 0 | 0 | 0 | ||
| c6 | 0 | 0 | 0 | 0 | 0 | 0 | 0 | ||
See category definitions for details.
Statistical distribution
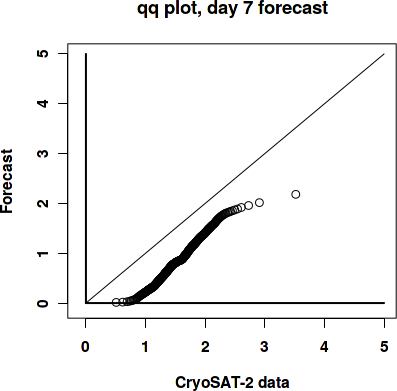
|
|
Sea ice thickness, day 7 forecast
Generated by /metno/routine/sms/V2/SIthickness/c2iceWebPage.sh Fri Nov 20 13:46:21 UTC 2020 on arcmfcval