Validation of ice thickness - Full domain
Bulletin date: 2020-10-29
Model: ARC MFC - TOPAZ
Data source: UCL CryoSAT-2 sea ice thickness
Validation statistics summary
| Bias (m) | RMS (m) | total grids | low SIT | OK SIT | high SIT | |
|---|---|---|---|---|---|---|
| Best estimate | -0.63 | 0.79 | 17422 | 7555 | 9804 | 63 |
| Day 1 forecast | -0.62 | 0.78 | 17422 | 7379 | 9972 | 71 |
| Day 4 forecast | -0.62 | 0.79 | 17422 | 7501 | 9848 | 73 |
| Day 7 forecast | -0.61 | 0.77 | 17422 | 7110 | 10244 | 68 |
| Day 10 forecast | -0.64 | 0.8 | 17422 | 7803 | 9545 | 74 |
Numbers in the three rightmost columns are grid counts. Regions with high/low sea ice thickness correspond to areas with model offsets from the gridded observations outside of one standard deviation. (Standard deviations are provided in the observational product.)
Definition of categories:
| Category | Sea ice thickness |
|---|---|
| c1 | <1m |
| c2 | 1 - 1.5m |
| c3 | 1.5 - 2m |
| c4 | 2 - 2.5m |
| c5 | 2.5 - 3m |
| c6 | >3m |
Best estimate vs. observations
Contingency table
| observations | |||||||||
|---|---|---|---|---|---|---|---|---|---|
| open | c1 | c2 | c3 | c4 | c5 | c6 | |||
| m o d e l |
open | 0 | 0 | 0 | 0 | 0 | 0 | 0 | |
| c1 | 0 | 0.09 | 0.398 | 0.167 | 0.042 | 0.003 | 0.001 | ||
| c2 | 0 | 0.003 | 0.069 | 0.098 | 0.025 | 0.002 | 0.001 | ||
| c3 | 0 | 0.001 | 0.04 | 0.045 | 0.009 | 0.002 | 0 | ||
| c4 | 0 | 0 | 0.002 | 0.001 | 0 | 0 | 0 | ||
| c5 | 0 | 0 | 0 | 0 | 0 | 0 | 0 | ||
| c6 | 0 | 0 | 0 | 0 | 0 | 0 | 0 | ||
See category definitions for details.
Statistical distribution
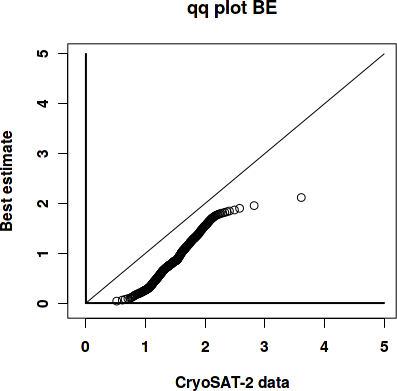
|
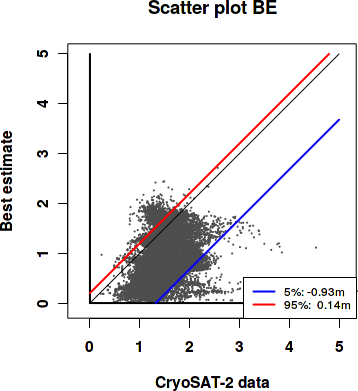
|
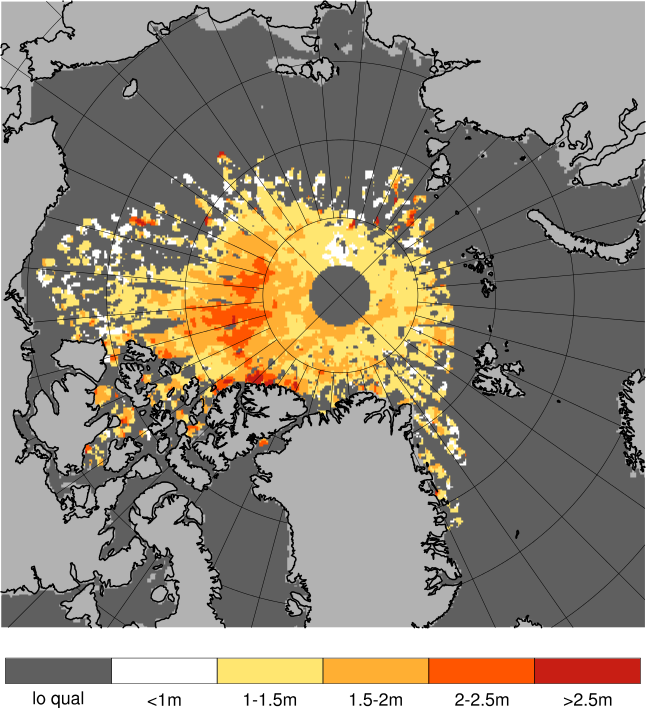
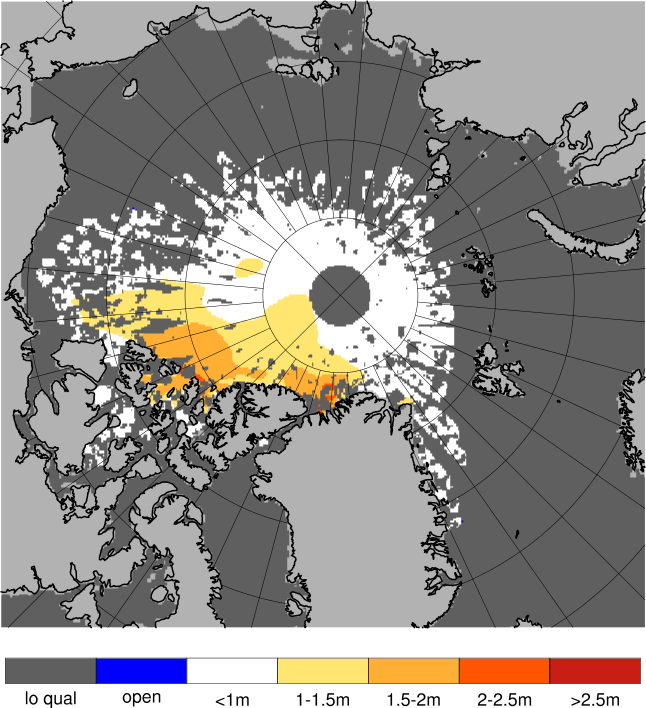
Observed sea ice thickness from CryoSAT
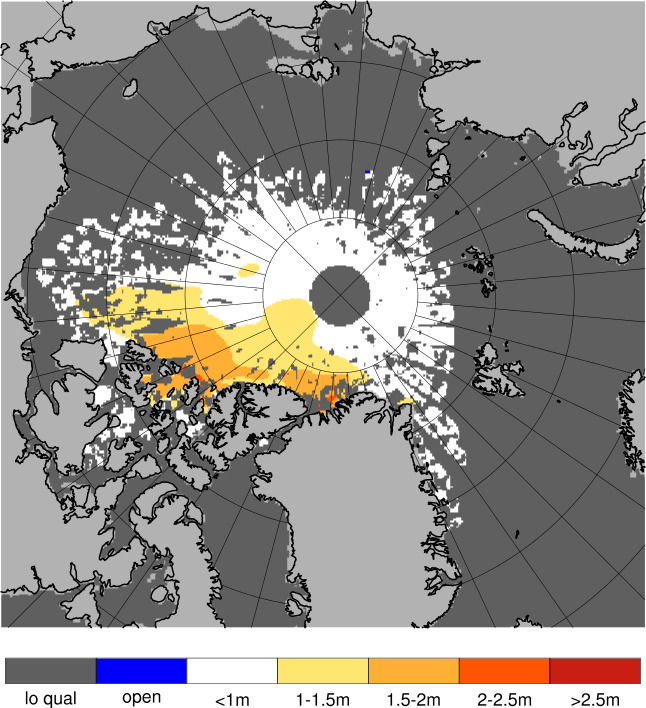
Sea ice thickness, best estimate product
Day 1 forecast vs. observations
Contingency table
| observations | |||||||||
|---|---|---|---|---|---|---|---|---|---|
| open | c1 | c2 | c3 | c4 | c5 | c6 | |||
| m o d e l |
open | 0 | 0 | 0 | 0 | 0 | 0 | 0 | |
| c1 | 0 | 0.09 | 0.396 | 0.163 | 0.04 | 0.003 | 0.002 | ||
| c2 | 0 | 0.004 | 0.071 | 0.103 | 0.028 | 0.002 | 0.001 | ||
| c3 | 0 | 0.001 | 0.039 | 0.044 | 0.008 | 0.002 | 0 | ||
| c4 | 0 | 0 | 0.003 | 0.001 | 0 | 0 | 0 | ||
| c5 | 0 | 0 | 0 | 0 | 0 | 0 | 0 | ||
| c6 | 0 | 0 | 0 | 0 | 0 | 0 | 0 | ||
See category definitions for details.
Statistical distribution
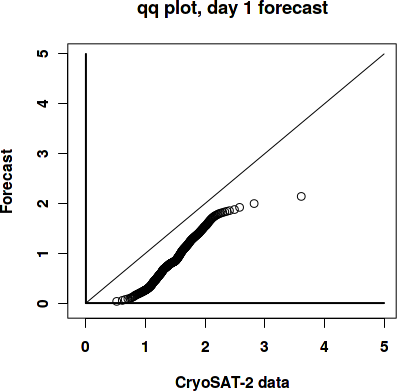
|

|
Sea ice thickness, day 1 forecast

Day 7 forecast vs. observations
Contingency table
| observations | |||||||||
|---|---|---|---|---|---|---|---|---|---|
| open | c1 | c2 | c3 | c4 | c5 | c6 | |||
| m o d e l |
open | 0 | 0 | 0 | 0 | 0 | 0 | 0 | |
| c1 | 0 | 0.09 | 0.396 | 0.16 | 0.039 | 0.003 | 0.002 | ||
| c2 | 0 | 0.004 | 0.071 | 0.105 | 0.029 | 0.002 | 0.001 | ||
| c3 | 0 | 0.001 | 0.039 | 0.045 | 0.009 | 0.002 | 0 | ||
| c4 | 0 | 0 | 0.002 | 0.001 | 0 | 0 | 0 | ||
| c5 | 0 | 0 | 0 | 0 | 0 | 0 | 0 | ||
| c6 | 0 | 0 | 0 | 0 | 0 | 0 | 0 | ||
See category definitions for details.
Statistical distribution

|
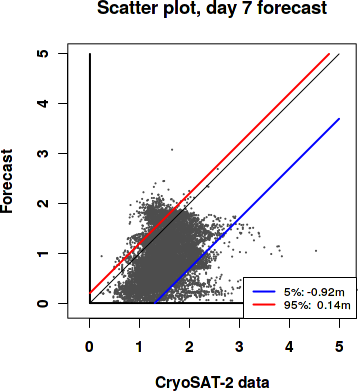
|
Sea ice thickness, day 7 forecast
Generated by /metno/routine/sms/V2/SIthickness/c2iceWebPage.sh Fri Nov 20 13:45:27 UTC 2020 on arcmfcval