Validation of ice thickness - Full domain
Bulletin date: 2020-10-15
Model: ARC MFC - TOPAZ
Data source: UCL CryoSAT-2 sea ice thickness
Validation statistics summary
| Bias (m) | RMS (m) | total grids | low SIT | OK SIT | high SIT | |
|---|---|---|---|---|---|---|
| Best estimate | -0.48 | 0.67 | 14666 | 5336 | 9095 | 235 |
| Day 1 forecast | -0.47 | 0.67 | 14666 | 5171 | 9235 | 260 |
| Day 4 forecast | -0.47 | 0.67 | 14666 | 5234 | 9171 | 261 |
| Day 7 forecast | -0.47 | 0.66 | 14666 | 5097 | 9341 | 228 |
| Day 10 forecast | -0.48 | 0.67 | 14666 | 5243 | 9184 | 239 |
Numbers in the three rightmost columns are grid counts. Regions with high/low sea ice thickness correspond to areas with model offsets from the gridded observations outside of one standard deviation. (Standard deviations are provided in the observational product.)
Definition of categories:
| Category | Sea ice thickness |
|---|---|
| c1 | <1m |
| c2 | 1 - 1.5m |
| c3 | 1.5 - 2m |
| c4 | 2 - 2.5m |
| c5 | 2.5 - 3m |
| c6 | >3m |
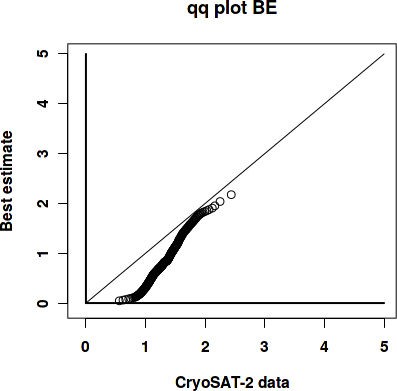
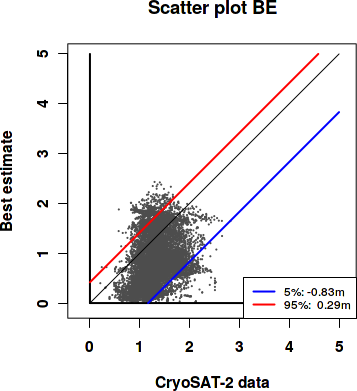
Best estimate vs. observations
Contingency table
| observations | |||||||||
|---|---|---|---|---|---|---|---|---|---|
| open | c1 | c2 | c3 | c4 | c5 | c6 | |||
| m o d e l |
open | 0 | 0 | 0 | 0 | 0 | 0 | 0 | |
| c1 | 0 | 0.112 | 0.444 | 0.131 | 0.012 | 0 | 0 | ||
| c2 | 0 | 0.011 | 0.13 | 0.048 | 0.004 | 0 | 0 | ||
| c3 | 0 | 0.007 | 0.064 | 0.027 | 0.004 | 0 | 0 | ||
| c4 | 0 | 0 | 0.004 | 0.002 | 0 | 0 | 0 | ||
| c5 | 0 | 0 | 0 | 0 | 0 | 0 | 0 | ||
| c6 | 0 | 0 | 0 | 0 | 0 | 0 | 0 | ||
See category definitions for details.
Statistical distribution
|
|
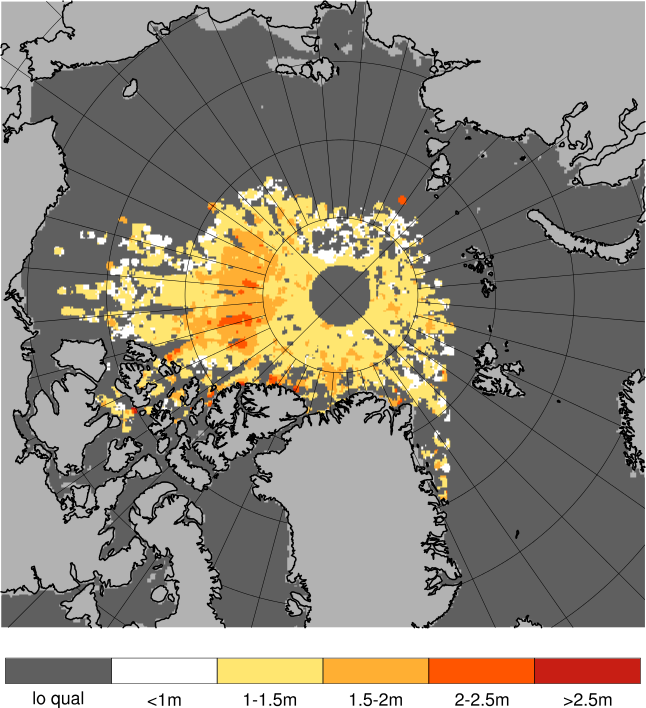
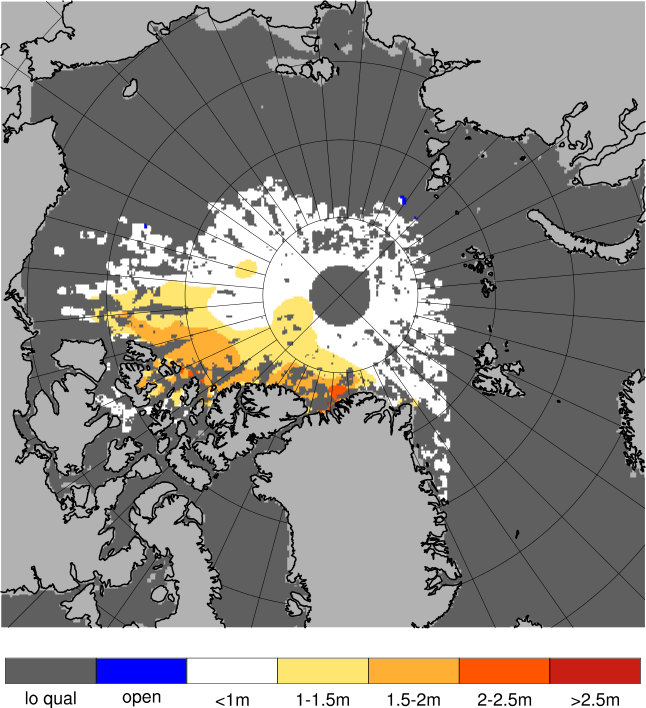
Observed sea ice thickness from CryoSAT
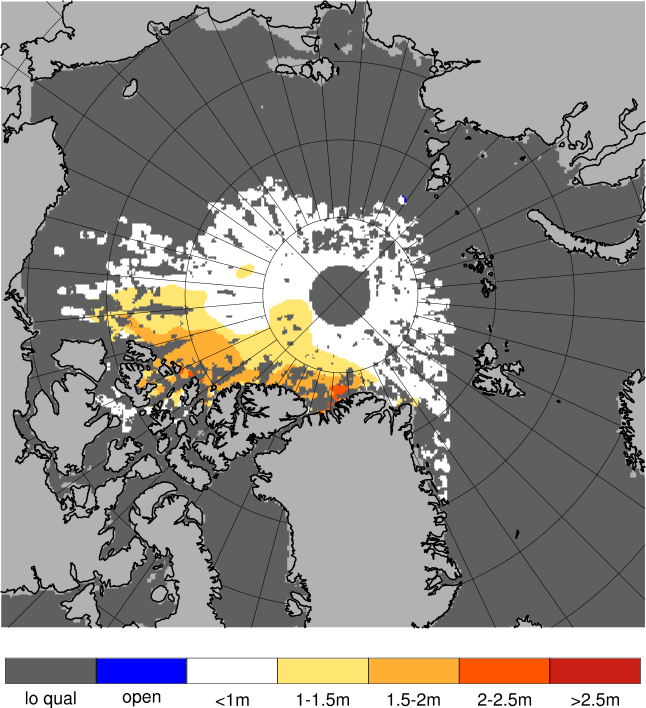
Sea ice thickness, best estimate product
Day 1 forecast vs. observations
Contingency table
| observations | |||||||||
|---|---|---|---|---|---|---|---|---|---|
| open | c1 | c2 | c3 | c4 | c5 | c6 | |||
| m o d e l |
open | 0 | 0 | 0 | 0 | 0.001 | 0 | 0 | |
| c1 | 0 | 0.112 | 0.437 | 0.127 | 0.011 | 0 | 0 | ||
| c2 | 0 | 0.009 | 0.134 | 0.052 | 0.004 | 0 | 0 | ||
| c3 | 0 | 0.008 | 0.067 | 0.027 | 0.004 | 0 | 0 | ||
| c4 | 0 | 0 | 0.004 | 0.002 | 0 | 0 | 0 | ||
| c5 | 0 | 0 | 0 | 0 | 0 | 0 | 0 | ||
| c6 | 0 | 0 | 0 | 0 | 0 | 0 | 0 | ||
See category definitions for details.
Statistical distribution
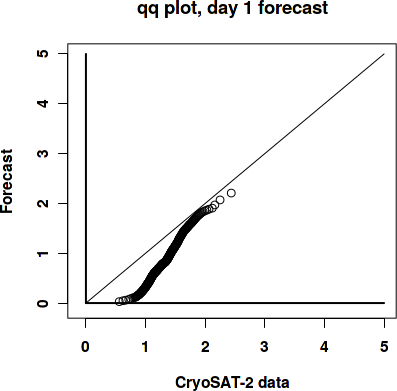
|

|
Sea ice thickness, day 1 forecast

Day 7 forecast vs. observations
Contingency table
| observations | |||||||||
|---|---|---|---|---|---|---|---|---|---|
| open | c1 | c2 | c3 | c4 | c5 | c6 | |||
| m o d e l |
open | 0 | 0 | 0 | 0 | 0.001 | 0 | 0 | |
| c1 | 0 | 0.112 | 0.433 | 0.127 | 0.011 | 0 | 0 | ||
| c2 | 0 | 0.009 | 0.137 | 0.052 | 0.005 | 0 | 0 | ||
| c3 | 0 | 0.007 | 0.068 | 0.027 | 0.004 | 0 | 0 | ||
| c4 | 0 | 0 | 0.004 | 0.002 | 0 | 0 | 0 | ||
| c5 | 0 | 0 | 0 | 0 | 0 | 0 | 0 | ||
| c6 | 0 | 0 | 0 | 0 | 0 | 0 | 0 | ||
See category definitions for details.
Statistical distribution

|
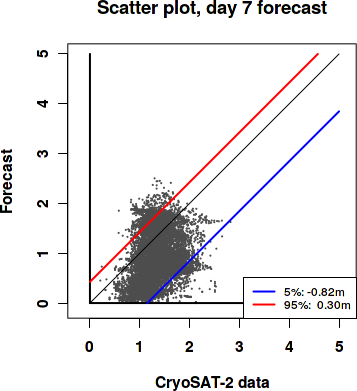
|
Sea ice thickness, day 7 forecast
Generated by /metno/routine/sms/V2/SIthickness/c2iceWebPage.sh Fri Nov 20 13:43:49 UTC 2020 on arcmfcval