Validation of ice thickness - Full domain
Bulletin date: 2020-10-01
Model: ARC MFC - TOPAZ
Data source: UCL CryoSAT-2 sea ice thickness
Validation statistics summary
| Bias (m) | RMS (m) | total grids | low SIT | OK SIT | high SIT | |
|---|---|---|---|---|---|---|
| Best estimate | -0.4 | 0.65 | 3677 | 1119 | 2423 | 135 |
| Day 1 forecast | -0.39 | 0.64 | 3677 | 1090 | 2452 | 135 |
| Day 4 forecast | -0.39 | 0.65 | 3677 | 1093 | 2454 | 130 |
| Day 7 forecast | -0.39 | 0.64 | 3677 | 1080 | 2472 | 125 |
| Day 10 forecast | -0.4 | 0.64 | 3677 | 1083 | 2478 | 116 |
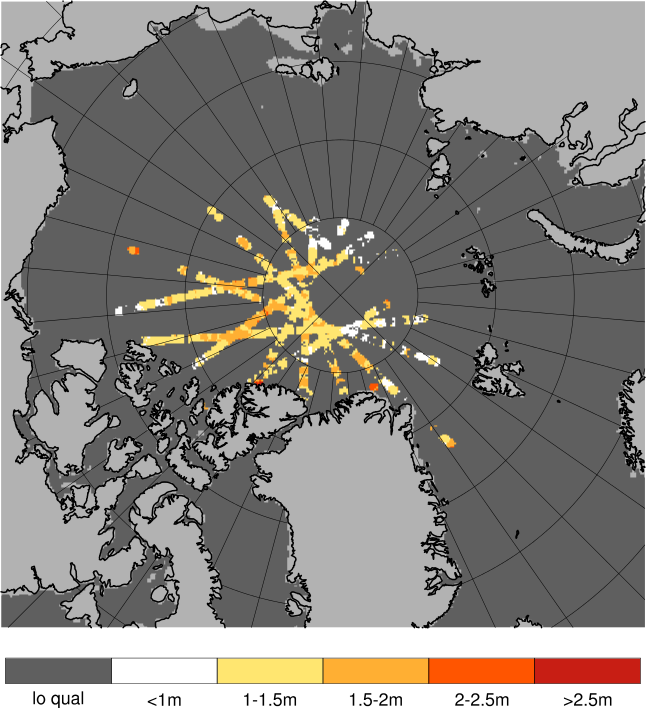
Numbers in the three rightmost columns are grid counts. Regions with high/low sea ice thickness correspond to areas with model offsets from the gridded observations outside of one standard deviation. (Standard deviations are provided in the observational product.)
Definition of categories:
| Category | Sea ice thickness |
|---|---|
| c1 | <1m |
| c2 | 1 - 1.5m |
| c3 | 1.5 - 2m |
| c4 | 2 - 2.5m |
| c5 | 2.5 - 3m |
| c6 | >3m |
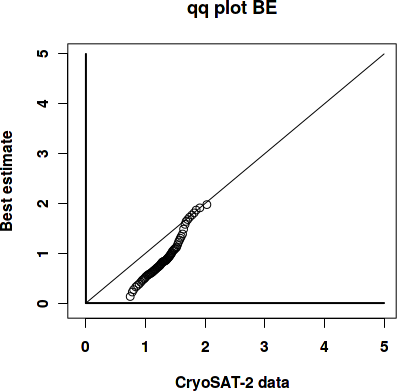
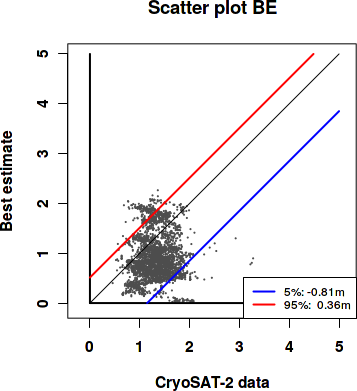
Best estimate vs. observations
Contingency table
| observations | |||||||||
|---|---|---|---|---|---|---|---|---|---|
| open | c1 | c2 | c3 | c4 | c5 | c6 | |||
| m o d e l |
open | 0 | 0 | 0 | 0 | 0 | 0 | 0 | |
| c1 | 0 | 0.126 | 0.395 | 0.152 | 0.01 | 0 | 0.001 | ||
| c2 | 0 | 0.02 | 0.113 | 0.053 | 0.001 | 0.001 | 0 | ||
| c3 | 0 | 0.008 | 0.082 | 0.031 | 0 | 0 | 0 | ||
| c4 | 0 | 0.001 | 0.005 | 0.001 | 0 | 0 | 0 | ||
| c5 | 0 | 0 | 0 | 0 | 0 | 0 | 0 | ||
| c6 | 0 | 0 | 0 | 0 | 0 | 0 | 0 | ||
See category definitions for details.
Statistical distribution
|
|
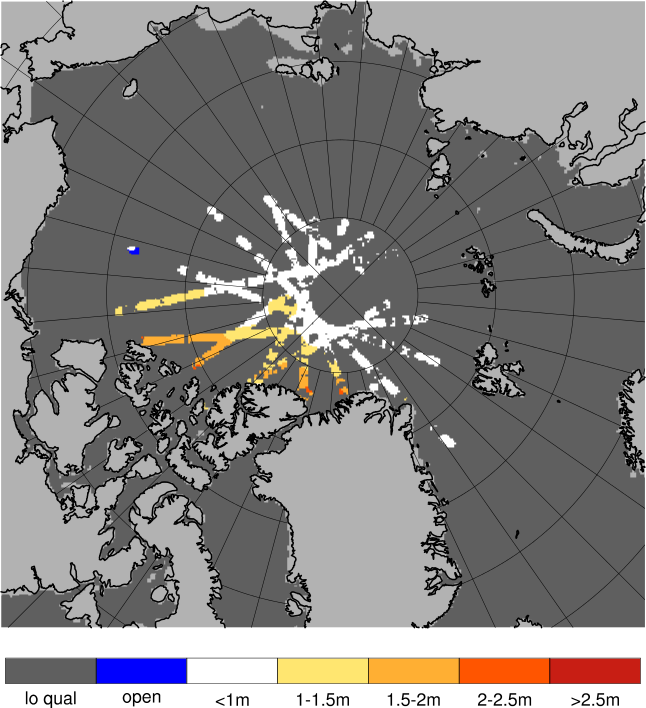
Observed sea ice thickness from CryoSAT
Sea ice thickness, best estimate product

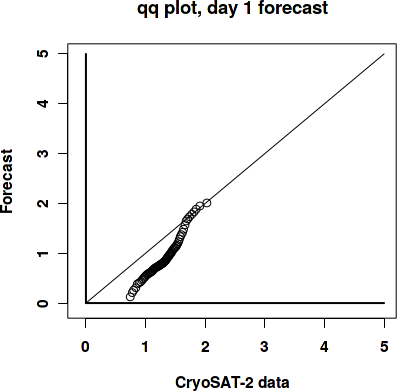
Day 1 forecast vs. observations
Contingency table
| observations | |||||||||
|---|---|---|---|---|---|---|---|---|---|
| open | c1 | c2 | c3 | c4 | c5 | c6 | |||
| m o d e l |
open | 0 | 0 | 0 | 0 | 0.001 | 0 | 0 | |
| c1 | 0 | 0.125 | 0.384 | 0.148 | 0.01 | 0 | 0.001 | ||
| c2 | 0 | 0.021 | 0.125 | 0.058 | 0.001 | 0.001 | 0 | ||
| c3 | 0 | 0.007 | 0.079 | 0.03 | 0 | 0 | 0 | ||
| c4 | 0 | 0.002 | 0.007 | 0.001 | 0 | 0 | 0 | ||
| c5 | 0 | 0 | 0 | 0 | 0 | 0 | 0 | ||
| c6 | 0 | 0 | 0 | 0 | 0 | 0 | 0 | ||
See category definitions for details.
Statistical distribution
|

|
Sea ice thickness, day 1 forecast

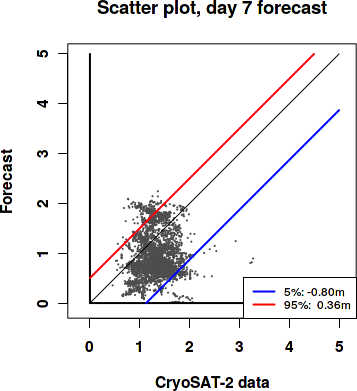
Day 7 forecast vs. observations
Contingency table
| observations | |||||||||
|---|---|---|---|---|---|---|---|---|---|
| open | c1 | c2 | c3 | c4 | c5 | c6 | |||
| m o d e l |
open | 0 | 0 | 0 | 0.002 | 0.002 | 0 | 0 | |
| c1 | 0 | 0.126 | 0.386 | 0.147 | 0.008 | 0 | 0.001 | ||
| c2 | 0 | 0.021 | 0.125 | 0.056 | 0.001 | 0.001 | 0 | ||
| c3 | 0 | 0.007 | 0.081 | 0.031 | 0 | 0 | 0 | ||
| c4 | 0 | 0.001 | 0.004 | 0 | 0 | 0 | 0 | ||
| c5 | 0 | 0 | 0 | 0 | 0 | 0 | 0 | ||
| c6 | 0 | 0 | 0 | 0 | 0 | 0 | 0 | ||
See category definitions for details.
Statistical distribution

|
|
Sea ice thickness, day 7 forecast
Generated by /metno/routine/sms/V2/SIthickness/c2iceWebPage.sh Fri Nov 20 13:42:15 UTC 2020 on arcmfcval