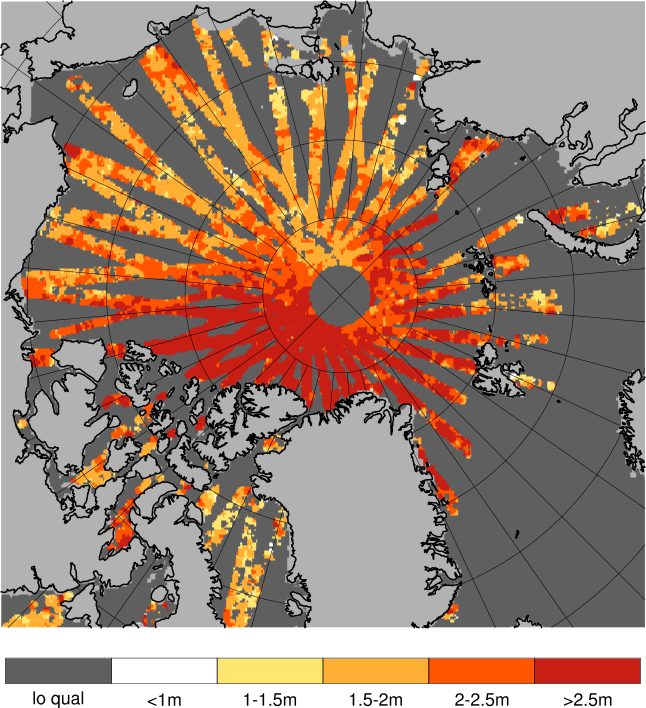
Validation of ice thickness - Full domain
Bulletin date: 2020-04-02
Model: ARC MFC - TOPAZ
Data source: UCL CryoSAT-2 sea ice thickness
Validation statistics summary
| Bias (m) | RMS (m) | total grids | low SIT | OK SIT | high SIT | |
|---|---|---|---|---|---|---|
| Best estimate | -0.81 | 1.07 | 28388 | 10212 | 18125 | 51 |
| Day 1 forecast | -0.81 | 1.06 | 28388 | 10035 | 18302 | 51 |
| Day 4 forecast | -0.81 | 1.06 | 28388 | 10060 | 18279 | 49 |
| Day 7 forecast | -0.8 | 1.05 | 28388 | 9849 | 18492 | 47 |
| Day 10 forecast | -0.8 | 1.05 | 28388 | 9858 | 18481 | 49 |
Numbers in the three rightmost columns are grid counts. Regions with high/low sea ice thickness correspond to areas with model offsets from the gridded observations outside of one standard deviation. (Standard deviations are provided in the observational product.)
Definition of categories:
| Category | Sea ice thickness |
|---|---|
| c1 | <1m |
| c2 | 1 - 1.5m |
| c3 | 1.5 - 2m |
| c4 | 2 - 2.5m |
| c5 | 2.5 - 3m |
| c6 | >3m |
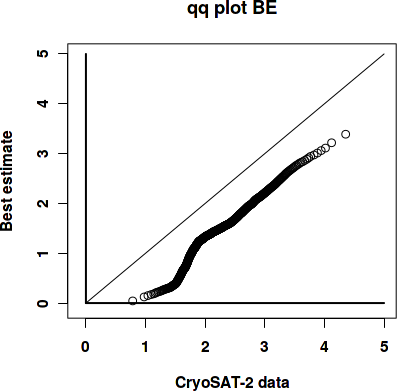
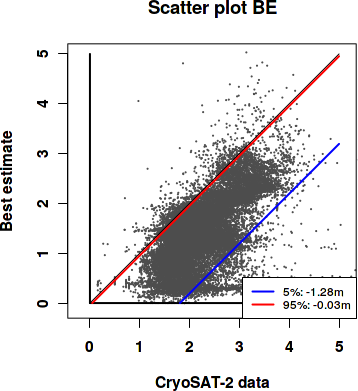
Best estimate vs. observations
Contingency table
| observations | |||||||||
|---|---|---|---|---|---|---|---|---|---|
| open | c1 | c2 | c3 | c4 | c5 | c6 | |||
| m o d e l |
open | 0 | 0 | 0 | 0.001 | 0 | 0 | 0 | |
| c1 | 0 | 0.003 | 0.044 | 0.114 | 0.048 | 0.018 | 0.009 | ||
| c2 | 0 | 0.001 | 0.017 | 0.176 | 0.11 | 0.043 | 0.009 | ||
| c3 | 0 | 0 | 0.003 | 0.067 | 0.103 | 0.042 | 0.009 | ||
| c4 | 0 | 0 | 0 | 0.002 | 0.018 | 0.044 | 0.055 | ||
| c5 | 0 | 0 | 0 | 0 | 0.002 | 0.018 | 0.031 | ||
| c6 | 0 | 0 | 0 | 0 | 0.001 | 0.003 | 0.009 | ||
See category definitions for details.
Statistical distribution
|
|
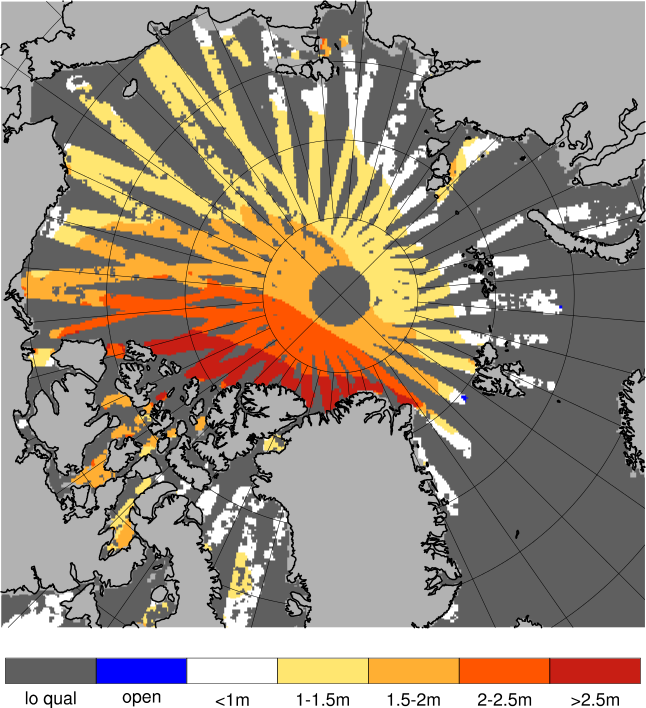
Observed sea ice thickness from CryoSAT
Sea ice thickness, best estimate product

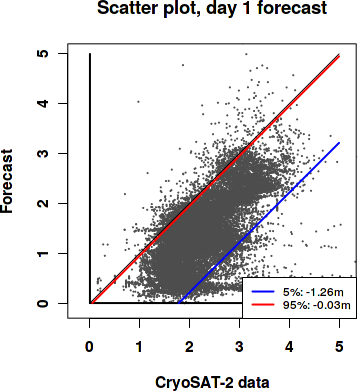
Day 1 forecast vs. observations
Contingency table
| observations | |||||||||
|---|---|---|---|---|---|---|---|---|---|
| open | c1 | c2 | c3 | c4 | c5 | c6 | |||
| m o d e l |
open | 0 | 0 | 0 | 0.001 | 0 | 0 | 0 | |
| c1 | 0 | 0.003 | 0.043 | 0.112 | 0.048 | 0.017 | 0.009 | ||
| c2 | 0 | 0.001 | 0.018 | 0.18 | 0.11 | 0.044 | 0.009 | ||
| c3 | 0 | 0 | 0.003 | 0.065 | 0.102 | 0.042 | 0.008 | ||
| c4 | 0 | 0 | 0 | 0.002 | 0.019 | 0.044 | 0.056 | ||
| c5 | 0 | 0 | 0 | 0 | 0.002 | 0.018 | 0.031 | ||
| c6 | 0 | 0 | 0 | 0 | 0.001 | 0.003 | 0.009 | ||
See category definitions for details.
Statistical distribution

|
|
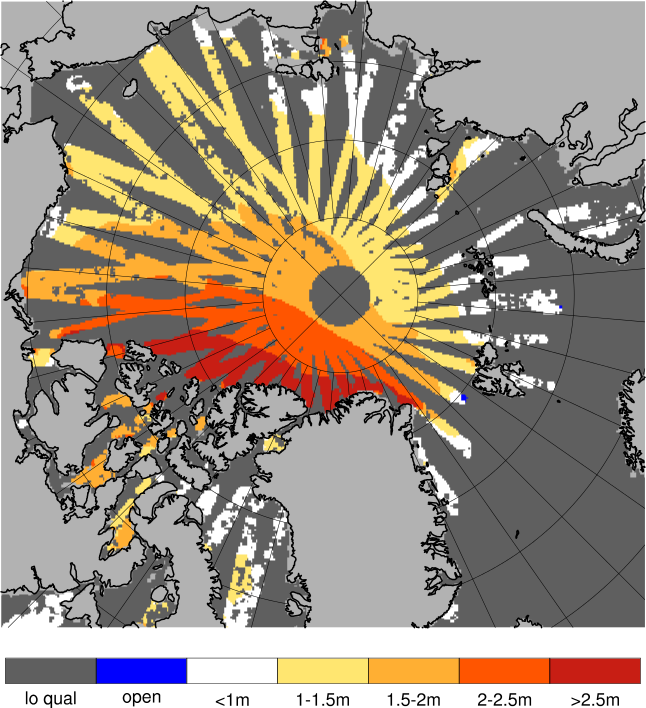
Sea ice thickness, day 1 forecast
Day 7 forecast vs. observations
Contingency table
| observations | |||||||||
|---|---|---|---|---|---|---|---|---|---|
| open | c1 | c2 | c3 | c4 | c5 | c6 | |||
| m o d e l |
open | 0 | 0 | 0.001 | 0.001 | 0 | 0 | 0 | |
| c1 | 0 | 0.003 | 0.044 | 0.111 | 0.046 | 0.016 | 0.008 | ||
| c2 | 0 | 0.001 | 0.018 | 0.177 | 0.11 | 0.044 | 0.01 | ||
| c3 | 0 | 0 | 0.003 | 0.068 | 0.104 | 0.041 | 0.008 | ||
| c4 | 0 | 0 | 0 | 0.002 | 0.019 | 0.044 | 0.055 | ||
| c5 | 0 | 0 | 0 | 0 | 0.002 | 0.019 | 0.032 | ||
| c6 | 0 | 0 | 0 | 0 | 0.001 | 0.003 | 0.01 | ||
See category definitions for details.
Statistical distribution
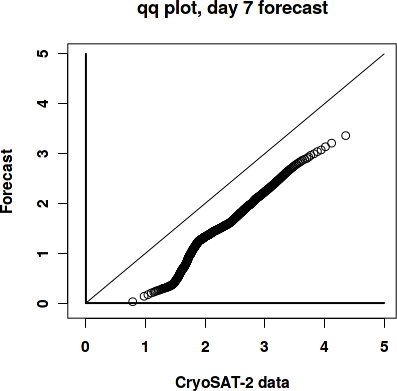
|
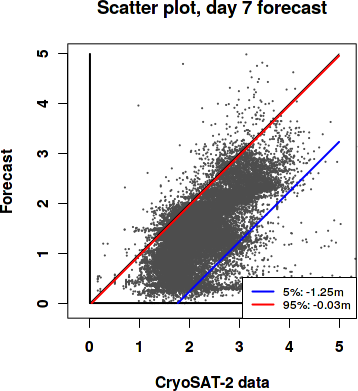
|
Sea ice thickness, day 7 forecast
Generated by /metno/routine/sms/V2/SIthickness/c2iceWebPage.sh Fri Apr 17 01:14:40 UTC 2020 on arcmfcval