Validation of ice thickness - Full domain
Bulletin date: 2020-03-26
Model: ARC MFC - TOPAZ
Data source: UCL CryoSAT-2 sea ice thickness
Validation statistics summary
| Bias (m) | RMS (m) | total grids | low SIT | OK SIT | high SIT | |
|---|---|---|---|---|---|---|
| Best estimate | -0.84 | 1.09 | 41386 | 15407 | 25912 | 67 |
| Day 1 forecast | -0.83 | 1.08 | 41386 | 15166 | 26153 | 67 |
| Day 4 forecast | -0.84 | 1.08 | 41386 | 15256 | 26064 | 66 |
| Day 7 forecast | -0.82 | 1.07 | 41386 | 14868 | 26449 | 69 |
| Day 10 forecast | -0.83 | 1.08 | 41386 | 14877 | 26448 | 61 |
Numbers in the three rightmost columns are grid counts. Regions with high/low sea ice thickness correspond to areas with model offsets from the gridded observations outside of one standard deviation. (Standard deviations are provided in the observational product.)
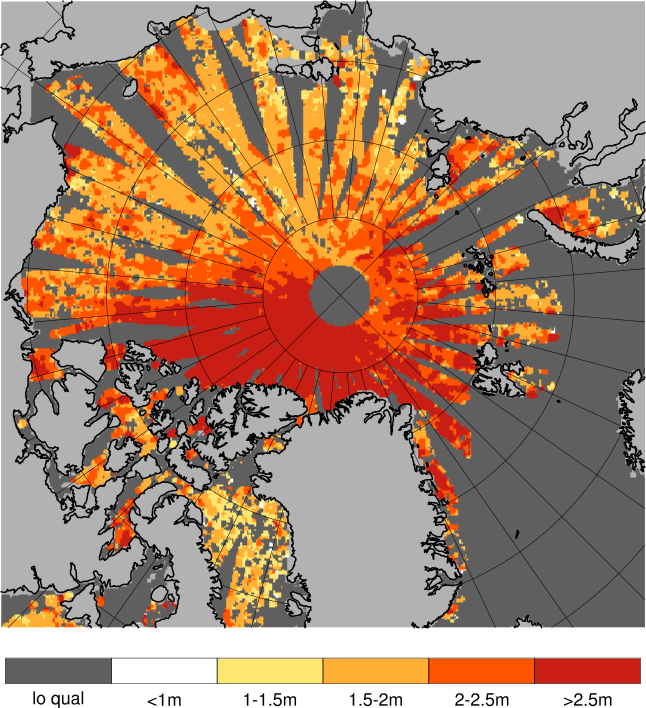
Definition of categories:
| Category | Sea ice thickness |
|---|---|
| c1 | <1m |
| c2 | 1 - 1.5m |
| c3 | 1.5 - 2m |
| c4 | 2 - 2.5m |
| c5 | 2.5 - 3m |
| c6 | >3m |
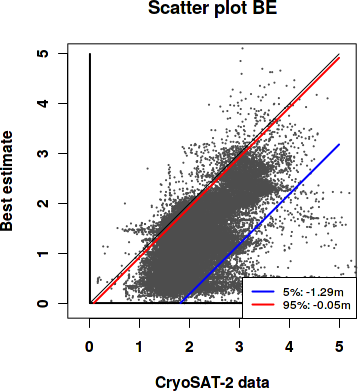
Best estimate vs. observations
Contingency table
| observations | |||||||||
|---|---|---|---|---|---|---|---|---|---|
| open | c1 | c2 | c3 | c4 | c5 | c6 | |||
| m o d e l |
open | 0 | 0 | 0 | 0 | 0 | 0 | 0 | |
| c1 | 0 | 0.003 | 0.052 | 0.141 | 0.059 | 0.018 | 0.009 | ||
| c2 | 0 | 0.001 | 0.018 | 0.19 | 0.117 | 0.034 | 0.007 | ||
| c3 | 0 | 0 | 0.003 | 0.059 | 0.086 | 0.039 | 0.01 | ||
| c4 | 0 | 0 | 0 | 0.003 | 0.013 | 0.034 | 0.052 | ||
| c5 | 0 | 0 | 0 | 0 | 0.002 | 0.012 | 0.027 | ||
| c6 | 0 | 0 | 0 | 0 | 0.001 | 0.002 | 0.007 | ||
See category definitions for details.
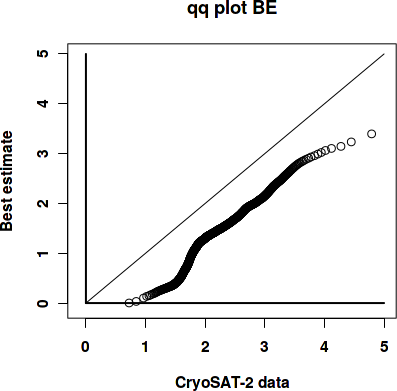
Statistical distribution
|
|
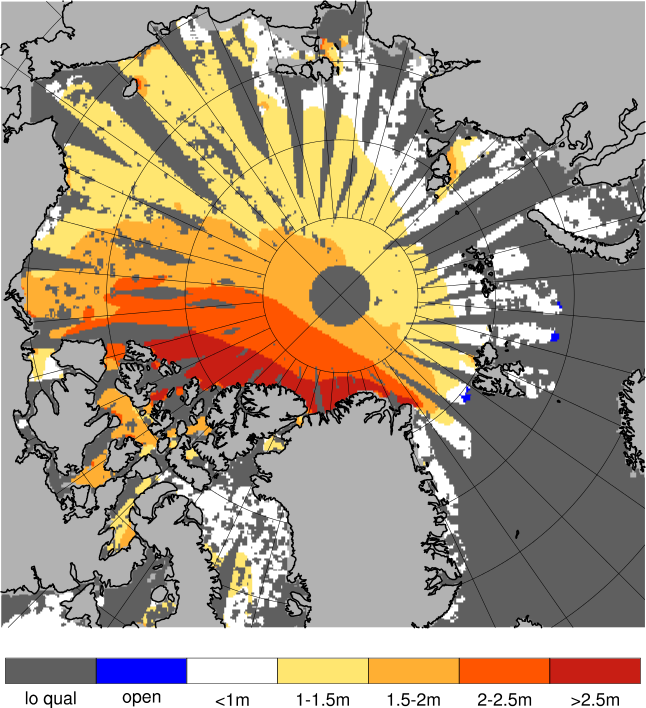
Observed sea ice thickness from CryoSAT
Sea ice thickness, best estimate product

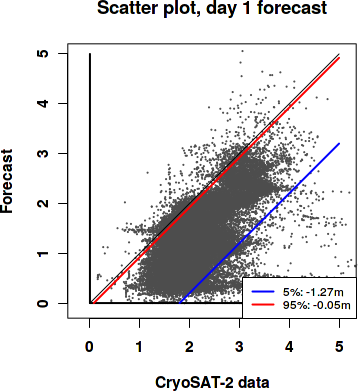
Day 1 forecast vs. observations
Contingency table
| observations | |||||||||
|---|---|---|---|---|---|---|---|---|---|
| open | c1 | c2 | c3 | c4 | c5 | c6 | |||
| m o d e l |
open | 0 | 0 | 0 | 0 | 0.001 | 0 | 0 | |
| c1 | 0 | 0.003 | 0.052 | 0.139 | 0.058 | 0.018 | 0.009 | ||
| c2 | 0 | 0.001 | 0.018 | 0.193 | 0.117 | 0.034 | 0.007 | ||
| c3 | 0 | 0 | 0.003 | 0.057 | 0.086 | 0.039 | 0.009 | ||
| c4 | 0 | 0 | 0 | 0.003 | 0.013 | 0.034 | 0.053 | ||
| c5 | 0 | 0 | 0 | 0 | 0.002 | 0.012 | 0.027 | ||
| c6 | 0 | 0 | 0 | 0 | 0.001 | 0.002 | 0.007 | ||
See category definitions for details.
Statistical distribution

|
|
Sea ice thickness, day 1 forecast
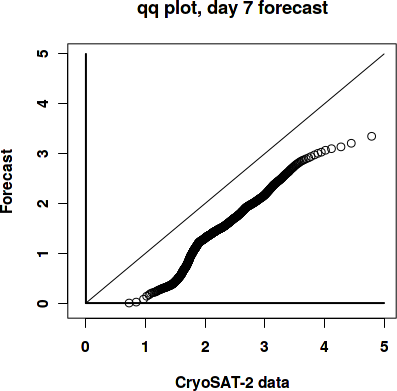
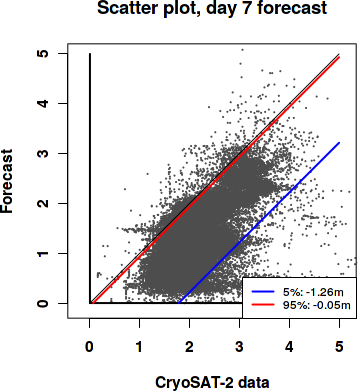
Day 7 forecast vs. observations
Contingency table
| observations | |||||||||
|---|---|---|---|---|---|---|---|---|---|
| open | c1 | c2 | c3 | c4 | c5 | c6 | |||
| m o d e l |
open | 0 | 0 | 0 | 0 | 0.001 | 0 | 0 | |
| c1 | 0 | 0.003 | 0.051 | 0.14 | 0.057 | 0.017 | 0.008 | ||
| c2 | 0 | 0.001 | 0.018 | 0.19 | 0.114 | 0.034 | 0.007 | ||
| c3 | 0 | 0 | 0.003 | 0.059 | 0.087 | 0.038 | 0.009 | ||
| c4 | 0 | 0 | 0 | 0.003 | 0.016 | 0.035 | 0.052 | ||
| c5 | 0 | 0 | 0 | 0 | 0.002 | 0.013 | 0.028 | ||
| c6 | 0 | 0 | 0 | 0 | 0.001 | 0.002 | 0.008 | ||
See category definitions for details.
Statistical distribution
|
|
Sea ice thickness, day 7 forecast

Generated by /metno/routine/sms/V2/SIthickness/c2iceWebPage.sh Fri Apr 10 01:10:21 UTC 2020 on arcmfcval