Validation of ice thickness - Full domain
Bulletin date: 2020-03-19
Model: ARC MFC - TOPAZ
Data source: UCL CryoSAT-2 sea ice thickness
Validation statistics summary
| Bias (m) | RMS (m) | total grids | low SIT | OK SIT | high SIT | |
|---|---|---|---|---|---|---|
| Best estimate | -0.84 | 1.1 | 42304 | 17272 | 24954 | 78 |
| Day 1 forecast | -0.84 | 1.09 | 42304 | 17124 | 25108 | 72 |
| Day 4 forecast | -0.84 | 1.09 | 42304 | 17239 | 24996 | 69 |
| Day 7 forecast | -0.82 | 1.08 | 42304 | 16670 | 25564 | 70 |
| Day 10 forecast | -0.84 | 1.09 | 42304 | 16882 | 25349 | 73 |
Numbers in the three rightmost columns are grid counts. Regions with high/low sea ice thickness correspond to areas with model offsets from the gridded observations outside of one standard deviation. (Standard deviations are provided in the observational product.)
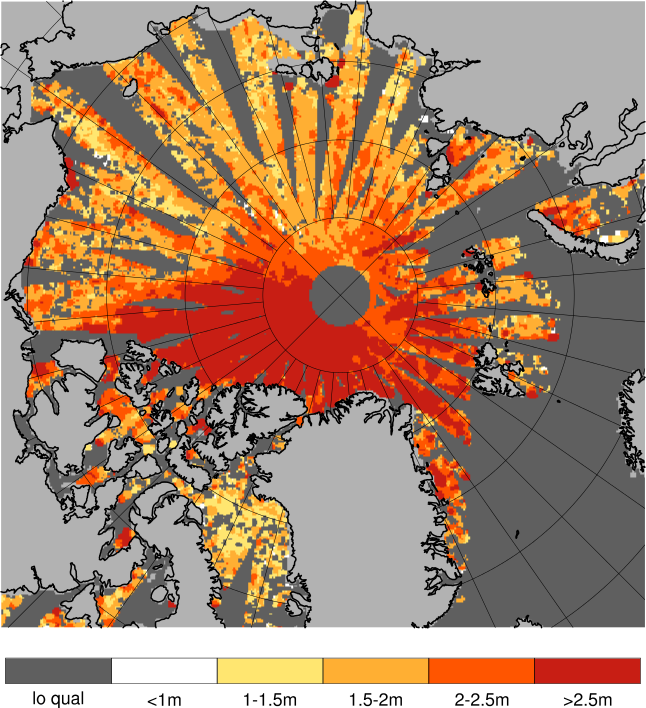
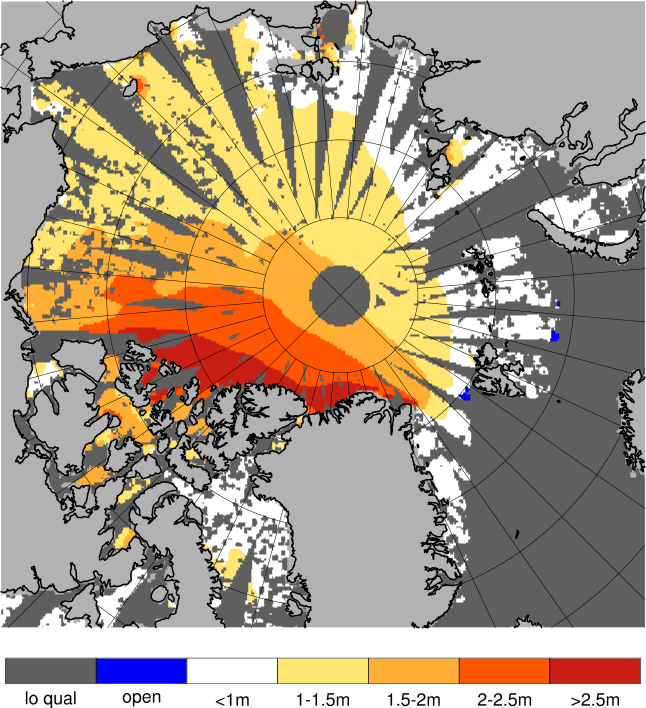
Definition of categories:
| Category | Sea ice thickness |
|---|---|
| c1 | <1m |
| c2 | 1 - 1.5m |
| c3 | 1.5 - 2m |
| c4 | 2 - 2.5m |
| c5 | 2.5 - 3m |
| c6 | >3m |
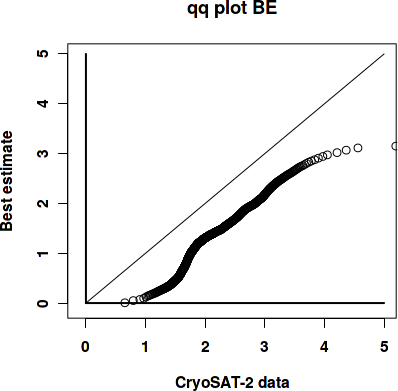
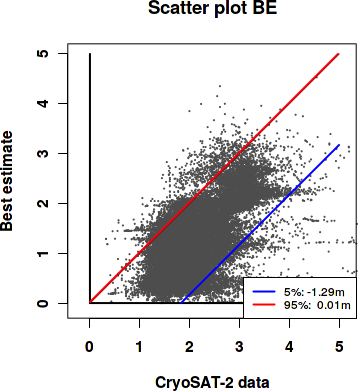
Best estimate vs. observations
Contingency table
| observations | |||||||||
|---|---|---|---|---|---|---|---|---|---|
| open | c1 | c2 | c3 | c4 | c5 | c6 | |||
| m o d e l |
open | 0 | 0 | 0 | 0 | 0 | 0 | 0 | |
| c1 | 0 | 0.004 | 0.065 | 0.149 | 0.064 | 0.018 | 0.009 | ||
| c2 | 0 | 0.001 | 0.042 | 0.179 | 0.107 | 0.026 | 0.009 | ||
| c3 | 0 | 0 | 0.006 | 0.051 | 0.064 | 0.046 | 0.011 | ||
| c4 | 0 | 0 | 0 | 0.005 | 0.011 | 0.036 | 0.049 | ||
| c5 | 0 | 0 | 0 | 0.001 | 0.004 | 0.013 | 0.02 | ||
| c6 | 0 | 0 | 0 | 0 | 0.001 | 0.003 | 0.004 | ||
See category definitions for details.
Statistical distribution
|
|
Observed sea ice thickness from CryoSAT
Sea ice thickness, best estimate product

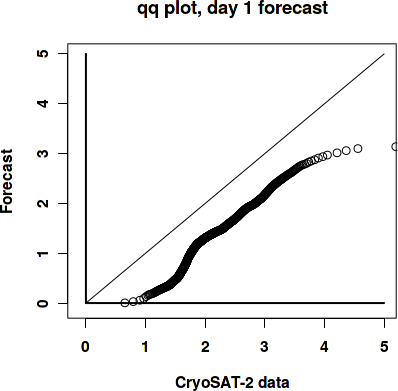
Day 1 forecast vs. observations
Contingency table
| observations | |||||||||
|---|---|---|---|---|---|---|---|---|---|
| open | c1 | c2 | c3 | c4 | c5 | c6 | |||
| m o d e l |
open | 0 | 0 | 0 | 0 | 0 | 0 | 0 | |
| c1 | 0 | 0.004 | 0.064 | 0.148 | 0.064 | 0.018 | 0.009 | ||
| c2 | 0 | 0.001 | 0.043 | 0.183 | 0.108 | 0.027 | 0.008 | ||
| c3 | 0 | 0 | 0.006 | 0.048 | 0.063 | 0.046 | 0.011 | ||
| c4 | 0 | 0 | 0 | 0.005 | 0.011 | 0.036 | 0.049 | ||
| c5 | 0 | 0 | 0 | 0.001 | 0.004 | 0.013 | 0.02 | ||
| c6 | 0 | 0 | 0 | 0 | 0.001 | 0.003 | 0.004 | ||
See category definitions for details.
Statistical distribution
|
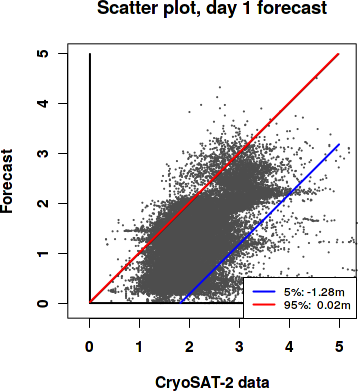
|
Sea ice thickness, day 1 forecast
Day 7 forecast vs. observations
Contingency table
| observations | |||||||||
|---|---|---|---|---|---|---|---|---|---|
| open | c1 | c2 | c3 | c4 | c5 | c6 | |||
| m o d e l |
open | 0 | 0 | 0 | 0 | 0 | 0.001 | 0 | |
| c1 | 0 | 0.004 | 0.064 | 0.148 | 0.063 | 0.018 | 0.009 | ||
| c2 | 0 | 0.001 | 0.043 | 0.181 | 0.105 | 0.026 | 0.008 | ||
| c3 | 0 | 0 | 0.006 | 0.051 | 0.065 | 0.044 | 0.01 | ||
| c4 | 0 | 0 | 0 | 0.005 | 0.012 | 0.038 | 0.05 | ||
| c5 | 0 | 0 | 0 | 0.001 | 0.004 | 0.014 | 0.021 | ||
| c6 | 0 | 0 | 0 | 0 | 0 | 0.003 | 0.004 | ||
See category definitions for details.
Statistical distribution

|
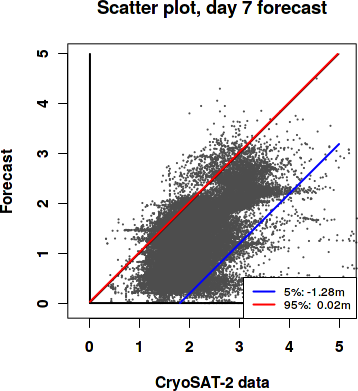
|
Sea ice thickness, day 7 forecast

Generated by /metno/routine/sms/V2/SIthickness/c2iceWebPage.sh Fri Apr 3 01:08:45 UTC 2020 on arcmfcval