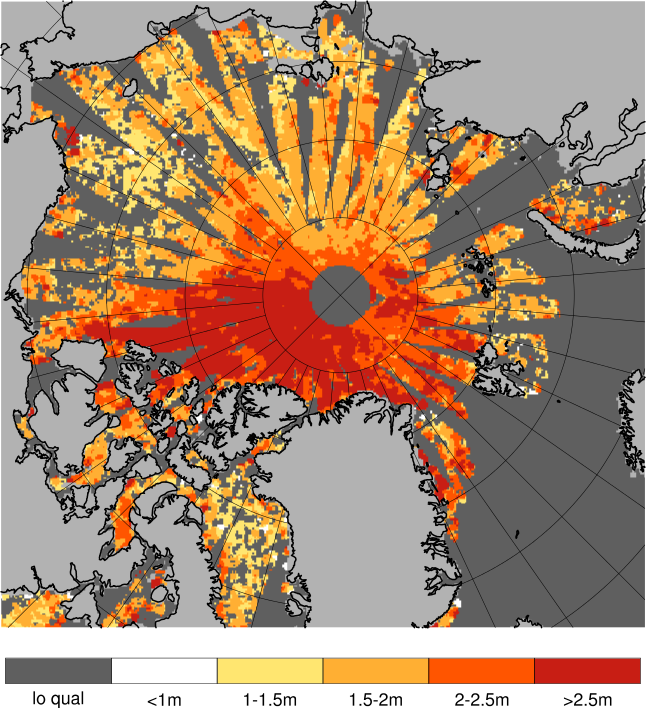
Validation of ice thickness - Full domain
Bulletin date: 2020-03-05
Model: ARC MFC - TOPAZ
Data source: UCL CryoSAT-2 sea ice thickness
Validation statistics summary
| Bias (m) | RMS (m) | total grids | low SIT | OK SIT | high SIT | |
|---|---|---|---|---|---|---|
| Best estimate | -0.78 | 1.06 | 40872 | 15532 | 25232 | 108 |
| Day 1 forecast | -0.78 | 1.05 | 40872 | 15437 | 25329 | 106 |
| Day 4 forecast | -0.79 | 1.06 | 40872 | 15580 | 25186 | 106 |
| Day 7 forecast | -0.77 | 1.04 | 40872 | 15133 | 25630 | 109 |
| Day 10 forecast | -0.78 | 1.05 | 40872 | 15400 | 25364 | 108 |
Numbers in the three rightmost columns are grid counts. Regions with high/low sea ice thickness correspond to areas with model offsets from the gridded observations outside of one standard deviation. (Standard deviations are provided in the observational product.)
Definition of categories:
| Category | Sea ice thickness |
|---|---|
| c1 | <1m |
| c2 | 1 - 1.5m |
| c3 | 1.5 - 2m |
| c4 | 2 - 2.5m |
| c5 | 2.5 - 3m |
| c6 | >3m |
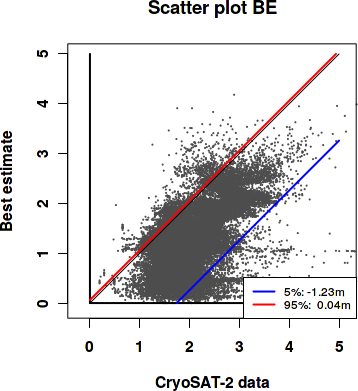
Best estimate vs. observations
Contingency table
| observations | |||||||||
|---|---|---|---|---|---|---|---|---|---|
| open | c1 | c2 | c3 | c4 | c5 | c6 | |||
| m o d e l |
open | 0 | 0 | 0 | 0.001 | 0 | 0 | 0 | |
| c1 | 0 | 0.006 | 0.07 | 0.158 | 0.054 | 0.013 | 0.006 | ||
| c2 | 0 | 0.002 | 0.077 | 0.203 | 0.096 | 0.023 | 0.005 | ||
| c3 | 0 | 0 | 0.006 | 0.045 | 0.052 | 0.046 | 0.01 | ||
| c4 | 0 | 0 | 0 | 0.005 | 0.017 | 0.042 | 0.029 | ||
| c5 | 0 | 0 | 0 | 0.001 | 0.006 | 0.008 | 0.013 | ||
| c6 | 0 | 0 | 0 | 0 | 0.001 | 0.001 | 0.003 | ||
See category definitions for details.
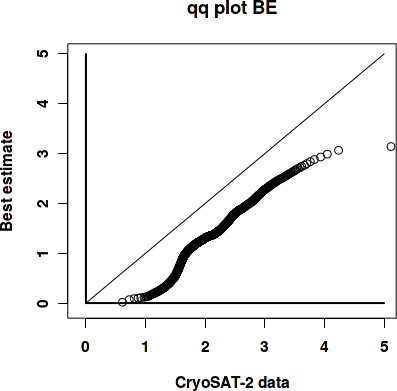
Statistical distribution
|
|
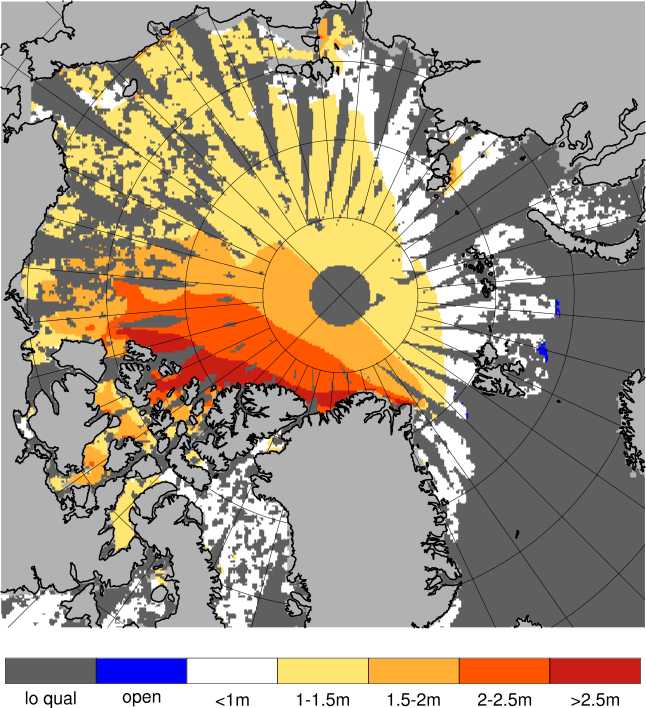
Observed sea ice thickness from CryoSAT
Sea ice thickness, best estimate product

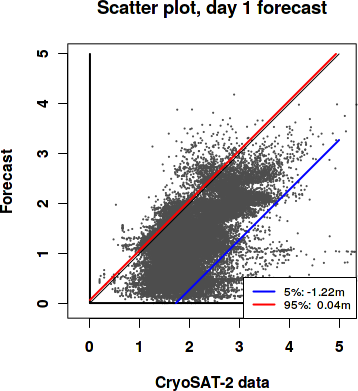
Day 1 forecast vs. observations
Contingency table
| observations | |||||||||
|---|---|---|---|---|---|---|---|---|---|
| open | c1 | c2 | c3 | c4 | c5 | c6 | |||
| m o d e l |
open | 0 | 0 | 0 | 0.001 | 0 | 0 | 0 | |
| c1 | 0 | 0.006 | 0.069 | 0.155 | 0.054 | 0.013 | 0.006 | ||
| c2 | 0 | 0.002 | 0.078 | 0.205 | 0.097 | 0.022 | 0.005 | ||
| c3 | 0 | 0 | 0.006 | 0.045 | 0.052 | 0.046 | 0.01 | ||
| c4 | 0 | 0 | 0 | 0.005 | 0.017 | 0.042 | 0.029 | ||
| c5 | 0 | 0 | 0 | 0.001 | 0.006 | 0.009 | 0.014 | ||
| c6 | 0 | 0 | 0 | 0 | 0.001 | 0.001 | 0.003 | ||
See category definitions for details.
Statistical distribution

|
|
Sea ice thickness, day 1 forecast
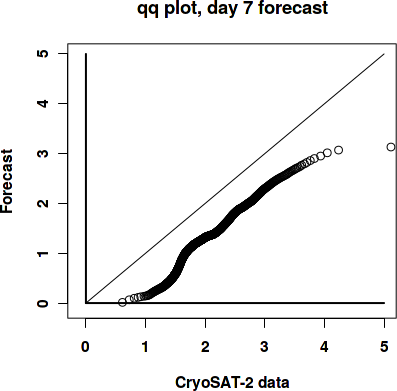
Day 7 forecast vs. observations
Contingency table
| observations | |||||||||
|---|---|---|---|---|---|---|---|---|---|
| open | c1 | c2 | c3 | c4 | c5 | c6 | |||
| m o d e l |
open | 0 | 0 | 0 | 0.001 | 0 | 0 | 0 | |
| c1 | 0 | 0.006 | 0.068 | 0.154 | 0.053 | 0.013 | 0.006 | ||
| c2 | 0 | 0.002 | 0.078 | 0.204 | 0.096 | 0.022 | 0.005 | ||
| c3 | 0 | 0 | 0.006 | 0.046 | 0.053 | 0.045 | 0.009 | ||
| c4 | 0 | 0 | 0 | 0.006 | 0.018 | 0.042 | 0.029 | ||
| c5 | 0 | 0 | 0 | 0.001 | 0.007 | 0.009 | 0.015 | ||
| c6 | 0 | 0 | 0 | 0 | 0.001 | 0.001 | 0.003 | ||
See category definitions for details.
Statistical distribution
|

|
Sea ice thickness, day 7 forecast

Generated by /metno/routine/sms/V2/SIthickness/c2iceWebPage.sh Fri Mar 20 01:10:34 UTC 2020 on arcmfcval