Validation of ice thickness - Full domain
Bulletin date: 2020-01-30
Model: ARC MFC - TOPAZ
Data source: UCL CryoSAT-2 sea ice thickness
Validation statistics summary
| Bias (m) | RMS (m) | total grids | low SIT | OK SIT | high SIT | |
|---|---|---|---|---|---|---|
| Best estimate | -0.76 | 0.97 | 37192 | 12858 | 24278 | 56 |
| Day 1 forecast | -0.75 | 0.97 | 37192 | 12780 | 24357 | 55 |
| Day 4 forecast | -0.76 | 0.97 | 37192 | 12939 | 24200 | 53 |
| Day 7 forecast | -0.74 | 0.96 | 37192 | 12230 | 24904 | 58 |
| Day 10 forecast | -0.76 | 0.97 | 37192 | 12667 | 24477 | 48 |
Numbers in the three rightmost columns are grid counts. Regions with high/low sea ice thickness correspond to areas with model offsets from the gridded observations outside of one standard deviation. (Standard deviations are provided in the observational product.)
Definition of categories:
| Category | Sea ice thickness |
|---|---|
| c1 | <1m |
| c2 | 1 - 1.5m |
| c3 | 1.5 - 2m |
| c4 | 2 - 2.5m |
| c5 | 2.5 - 3m |
| c6 | >3m |
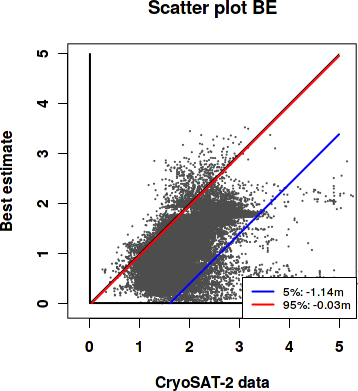
Best estimate vs. observations
Contingency table
| observations | |||||||||
|---|---|---|---|---|---|---|---|---|---|
| open | c1 | c2 | c3 | c4 | c5 | c6 | |||
| m o d e l |
open | 0 | 0 | 0.001 | 0 | 0 | 0 | 0.001 | |
| c1 | 0 | 0.015 | 0.225 | 0.168 | 0.049 | 0.011 | 0.009 | ||
| c2 | 0 | 0.003 | 0.076 | 0.146 | 0.065 | 0.006 | 0.002 | ||
| c3 | 0 | 0 | 0.003 | 0.034 | 0.077 | 0.062 | 0.011 | ||
| c4 | 0 | 0 | 0 | 0.006 | 0.013 | 0.007 | 0.003 | ||
| c5 | 0 | 0 | 0 | 0.001 | 0.002 | 0.001 | 0 | ||
| c6 | 0 | 0 | 0 | 0 | 0 | 0 | 0 | ||
See category definitions for details.
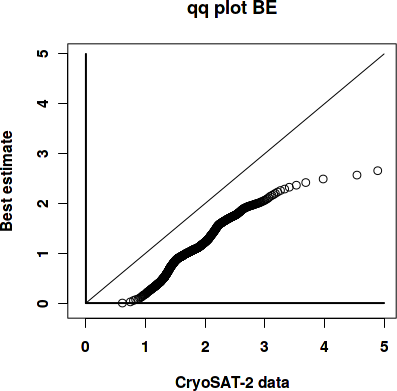
Statistical distribution
|
|
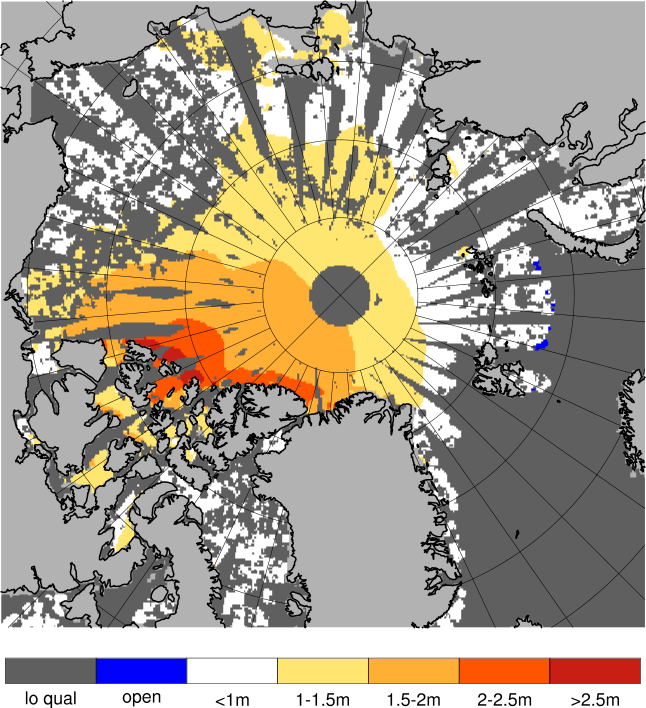
Observed sea ice thickness from CryoSAT
Sea ice thickness, best estimate product

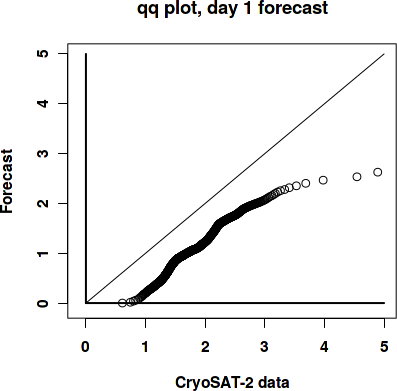
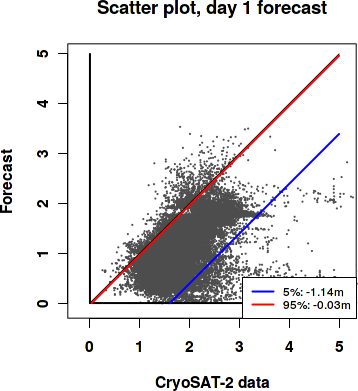
Day 1 forecast vs. observations
Contingency table
| observations | |||||||||
|---|---|---|---|---|---|---|---|---|---|
| open | c1 | c2 | c3 | c4 | c5 | c6 | |||
| m o d e l |
open | 0 | 0 | 0.001 | 0 | 0 | 0 | 0.001 | |
| c1 | 0 | 0.015 | 0.227 | 0.168 | 0.049 | 0.011 | 0.009 | ||
| c2 | 0 | 0.003 | 0.074 | 0.146 | 0.065 | 0.007 | 0.002 | ||
| c3 | 0 | 0 | 0.003 | 0.034 | 0.076 | 0.061 | 0.011 | ||
| c4 | 0 | 0 | 0 | 0.006 | 0.015 | 0.008 | 0.003 | ||
| c5 | 0 | 0 | 0 | 0.001 | 0.002 | 0.001 | 0 | ||
| c6 | 0 | 0 | 0 | 0 | 0 | 0 | 0 | ||
See category definitions for details.
Statistical distribution
|
|
Sea ice thickness, day 1 forecast

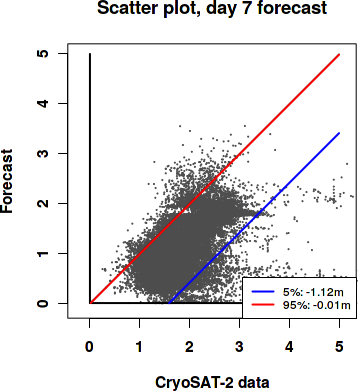
Day 7 forecast vs. observations
Contingency table
| observations | |||||||||
|---|---|---|---|---|---|---|---|---|---|
| open | c1 | c2 | c3 | c4 | c5 | c6 | |||
| m o d e l |
open | 0 | 0 | 0.001 | 0.001 | 0 | 0 | 0.001 | |
| c1 | 0 | 0.015 | 0.218 | 0.16 | 0.048 | 0.011 | 0.008 | ||
| c2 | 0 | 0.003 | 0.083 | 0.153 | 0.064 | 0.006 | 0.001 | ||
| c3 | 0 | 0 | 0.004 | 0.035 | 0.075 | 0.059 | 0.011 | ||
| c4 | 0 | 0 | 0 | 0.007 | 0.017 | 0.01 | 0.003 | ||
| c5 | 0 | 0 | 0 | 0.001 | 0.002 | 0.001 | 0 | ||
| c6 | 0 | 0 | 0 | 0 | 0 | 0 | 0 | ||
See category definitions for details.
Statistical distribution

|
|
Sea ice thickness, day 7 forecast
Generated by /metno/routine/sms/V2/SIthickness/c2iceWebPage.sh Fri Feb 14 01:05:44 UTC 2020 on arcmfcval