Validation of ice thickness - Full domain
Bulletin date: 2020-01-09
Model: ARC MFC - TOPAZ
Data source: UCL CryoSAT-2 sea ice thickness
Validation statistics summary
| Bias (m) | RMS (m) | total grids | low SIT | OK SIT | high SIT | |
|---|---|---|---|---|---|---|
| Best estimate | -0.8 | 0.92 | 35274 | 14458 | 20787 | 29 |
| Day 1 forecast | -0.79 | 0.92 | 35274 | 14386 | 20860 | 28 |
| Day 4 forecast | -0.8 | 0.92 | 35274 | 14582 | 20665 | 27 |
| Day 7 forecast | -0.77 | 0.9 | 35274 | 13702 | 21540 | 32 |
| Day 10 forecast | -0.8 | 0.93 | 35274 | 14532 | 20711 | 31 |
Numbers in the three rightmost columns are grid counts. Regions with high/low sea ice thickness correspond to areas with model offsets from the gridded observations outside of one standard deviation. (Standard deviations are provided in the observational product.)
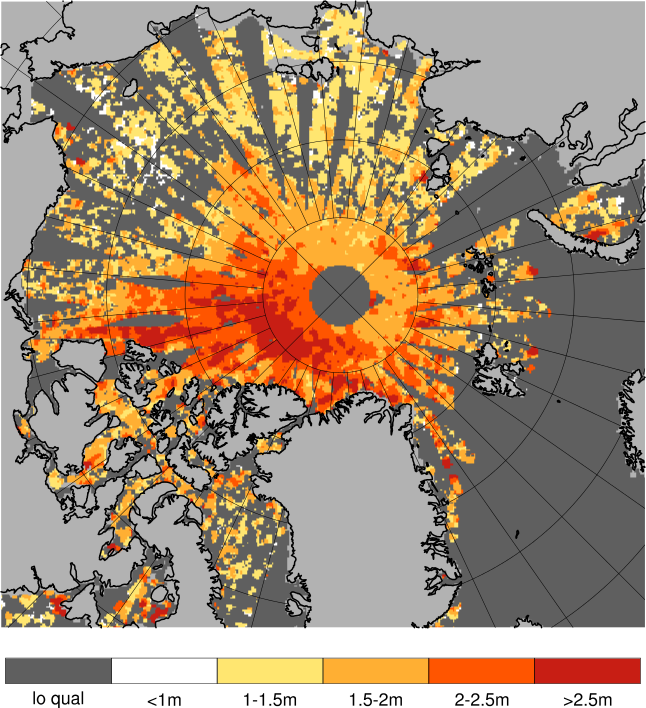
Definition of categories:
| Category | Sea ice thickness |
|---|---|
| c1 | <1m |
| c2 | 1 - 1.5m |
| c3 | 1.5 - 2m |
| c4 | 2 - 2.5m |
| c5 | 2.5 - 3m |
| c6 | >3m |
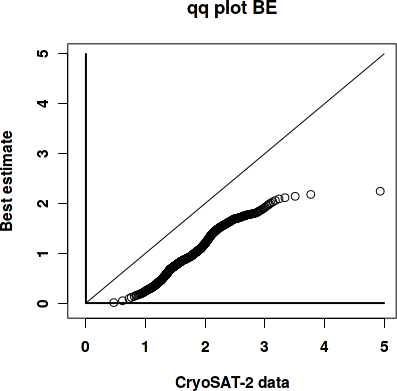
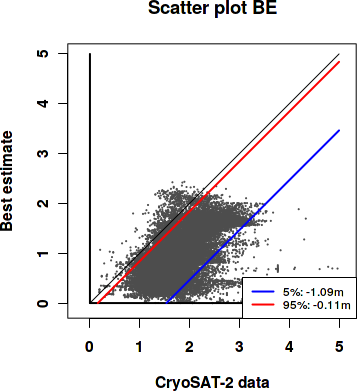
Best estimate vs. observations
Contingency table
| observations | |||||||||
|---|---|---|---|---|---|---|---|---|---|
| open | c1 | c2 | c3 | c4 | c5 | c6 | |||
| m o d e l |
open | 0 | 0 | 0 | 0 | 0 | 0 | 0 | |
| c1 | 0 | 0.026 | 0.275 | 0.227 | 0.051 | 0.009 | 0.005 | ||
| c2 | 0 | 0.001 | 0.024 | 0.119 | 0.071 | 0.009 | 0.001 | ||
| c3 | 0 | 0 | 0.003 | 0.029 | 0.078 | 0.049 | 0.01 | ||
| c4 | 0 | 0 | 0.001 | 0.005 | 0.005 | 0.001 | 0 | ||
| c5 | 0 | 0 | 0 | 0 | 0 | 0 | 0 | ||
| c6 | 0 | 0 | 0 | 0 | 0 | 0 | 0 | ||
See category definitions for details.
Statistical distribution
|
|
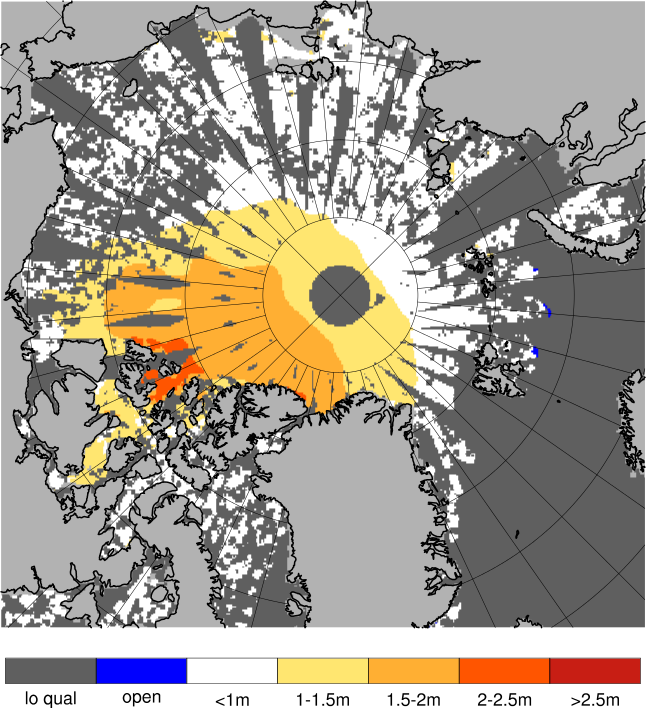
Observed sea ice thickness from CryoSAT
Sea ice thickness, best estimate product

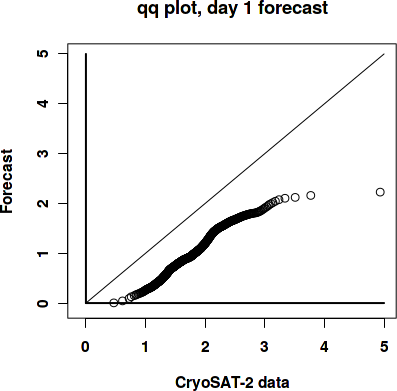
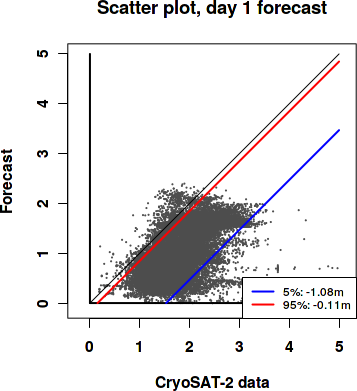
Day 1 forecast vs. observations
Contingency table
| observations | |||||||||
|---|---|---|---|---|---|---|---|---|---|
| open | c1 | c2 | c3 | c4 | c5 | c6 | |||
| m o d e l |
open | 0 | 0 | 0 | 0.001 | 0 | 0 | 0 | |
| c1 | 0 | 0.026 | 0.274 | 0.227 | 0.052 | 0.008 | 0.005 | ||
| c2 | 0 | 0.001 | 0.025 | 0.117 | 0.069 | 0.009 | 0.001 | ||
| c3 | 0 | 0 | 0.004 | 0.03 | 0.08 | 0.05 | 0.01 | ||
| c4 | 0 | 0 | 0.001 | 0.005 | 0.004 | 0.001 | 0 | ||
| c5 | 0 | 0 | 0 | 0 | 0 | 0 | 0 | ||
| c6 | 0 | 0 | 0 | 0 | 0 | 0 | 0 | ||
See category definitions for details.
Statistical distribution
|
|
Sea ice thickness, day 1 forecast

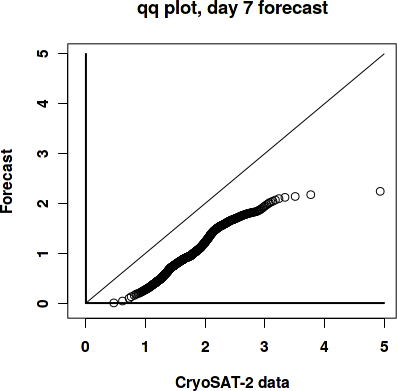
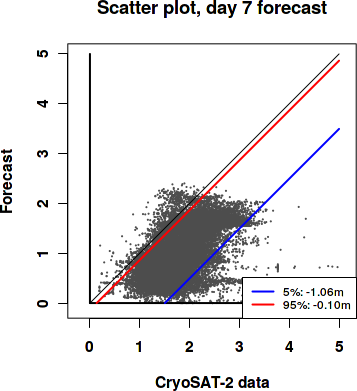
Day 7 forecast vs. observations
Contingency table
| observations | |||||||||
|---|---|---|---|---|---|---|---|---|---|
| open | c1 | c2 | c3 | c4 | c5 | c6 | |||
| m o d e l |
open | 0 | 0 | 0 | 0.001 | 0 | 0 | 0 | |
| c1 | 0 | 0.026 | 0.272 | 0.22 | 0.049 | 0.008 | 0.005 | ||
| c2 | 0 | 0.001 | 0.028 | 0.123 | 0.068 | 0.008 | 0.001 | ||
| c3 | 0 | 0 | 0.004 | 0.031 | 0.083 | 0.05 | 0.009 | ||
| c4 | 0 | 0 | 0.001 | 0.005 | 0.005 | 0.001 | 0.001 | ||
| c5 | 0 | 0 | 0 | 0 | 0 | 0 | 0 | ||
| c6 | 0 | 0 | 0 | 0 | 0 | 0 | 0 | ||
See category definitions for details.
Statistical distribution
|
|
Sea ice thickness, day 7 forecast
Generated by /metno/routine/sms/V2/SIthickness/c2iceWebPage.sh Fri Jan 24 01:09:37 UTC 2020 on arcmfcval