Validation of ice thickness - Full domain
Bulletin date: 2019-12-26
Model: ARC MFC - TOPAZ
Data source: UCL CryoSAT-2 sea ice thickness
Validation statistics summary
| Bias (m) | RMS (m) | total grids | low SIT | OK SIT | high SIT | |
|---|---|---|---|---|---|---|
| Best estimate | -0.8 | 0.9 | 31298 | 13883 | 17370 | 45 |
| Day 1 forecast | -0.8 | 0.9 | 31298 | 13837 | 17417 | 44 |
| Day 4 forecast | -0.8 | 0.9 | 31298 | 14087 | 17166 | 45 |
| Day 7 forecast | -0.78 | 0.88 | 31298 | 13221 | 18031 | 46 |
| Day 10 forecast | -0.81 | 0.91 | 31298 | 14218 | 17036 | 44 |
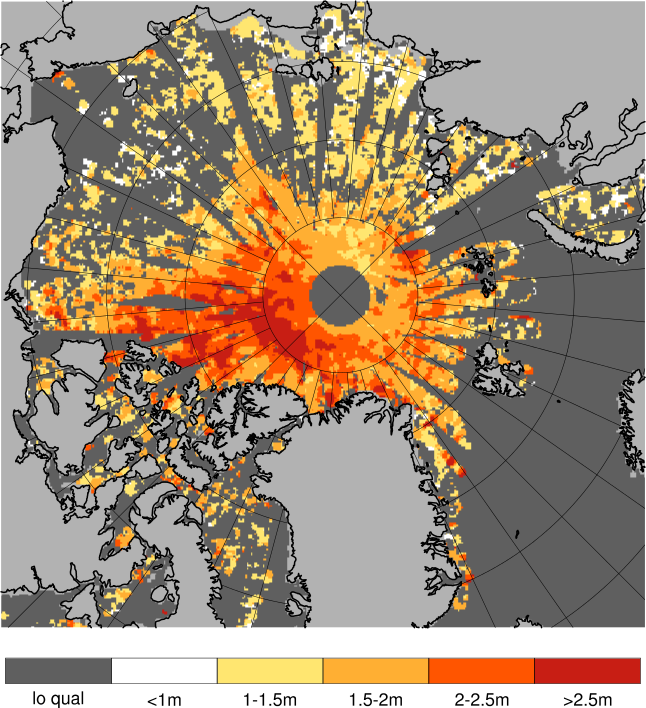
Numbers in the three rightmost columns are grid counts. Regions with high/low sea ice thickness correspond to areas with model offsets from the gridded observations outside of one standard deviation. (Standard deviations are provided in the observational product.)
Definition of categories:
| Category | Sea ice thickness |
|---|---|
| c1 | <1m |
| c2 | 1 - 1.5m |
| c3 | 1.5 - 2m |
| c4 | 2 - 2.5m |
| c5 | 2.5 - 3m |
| c6 | >3m |
Best estimate vs. observations
Contingency table
| observations | |||||||||
|---|---|---|---|---|---|---|---|---|---|
| open | c1 | c2 | c3 | c4 | c5 | c6 | |||
| m o d e l |
open | 0 | 0 | 0 | 0 | 0 | 0 | 0 | |
| c1 | 0 | 0.049 | 0.304 | 0.224 | 0.055 | 0.007 | 0.002 | ||
| c2 | 0 | 0 | 0.018 | 0.096 | 0.074 | 0.01 | 0.001 | ||
| c3 | 0 | 0 | 0.002 | 0.036 | 0.065 | 0.041 | 0.007 | ||
| c4 | 0 | 0 | 0.001 | 0.004 | 0.003 | 0.001 | 0.001 | ||
| c5 | 0 | 0 | 0 | 0 | 0 | 0 | 0 | ||
| c6 | 0 | 0 | 0 | 0 | 0 | 0 | 0 | ||
See category definitions for details.
Statistical distribution
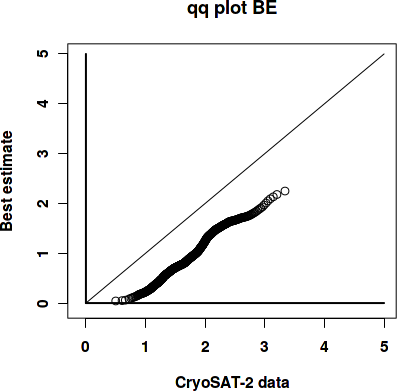
|
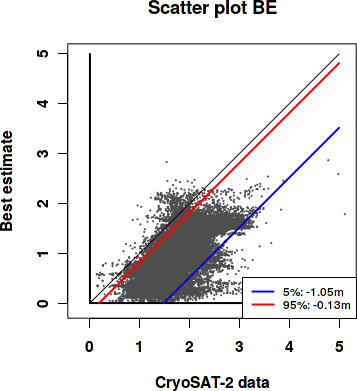
|
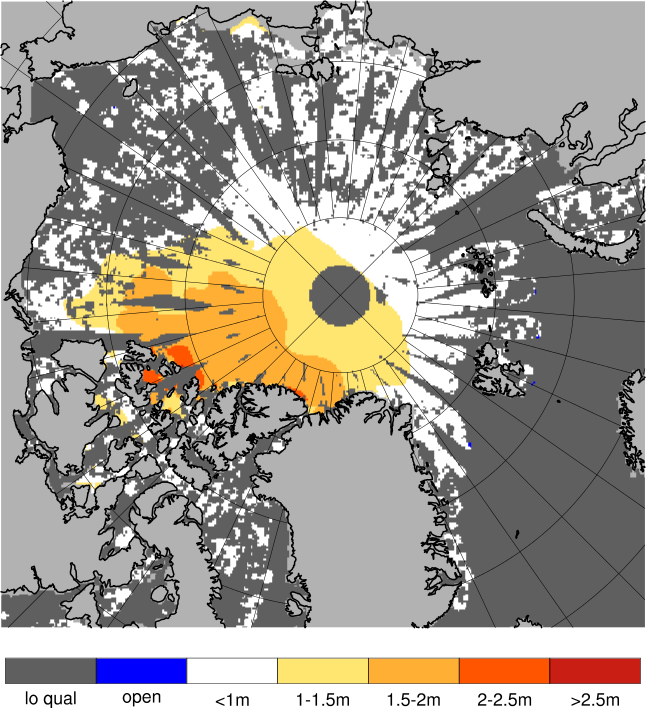
Observed sea ice thickness from CryoSAT
Sea ice thickness, best estimate product

Day 1 forecast vs. observations
Contingency table
| observations | |||||||||
|---|---|---|---|---|---|---|---|---|---|
| open | c1 | c2 | c3 | c4 | c5 | c6 | |||
| m o d e l |
open | 0 | 0 | 0 | 0 | 0 | 0 | 0 | |
| c1 | 0 | 0.049 | 0.303 | 0.224 | 0.055 | 0.007 | 0.002 | ||
| c2 | 0 | 0 | 0.018 | 0.096 | 0.074 | 0.011 | 0.001 | ||
| c3 | 0 | 0 | 0.002 | 0.037 | 0.065 | 0.039 | 0.007 | ||
| c4 | 0 | 0 | 0.001 | 0.004 | 0.002 | 0.001 | 0.001 | ||
| c5 | 0 | 0 | 0 | 0 | 0 | 0 | 0 | ||
| c6 | 0 | 0 | 0 | 0 | 0 | 0 | 0 | ||
See category definitions for details.
Statistical distribution
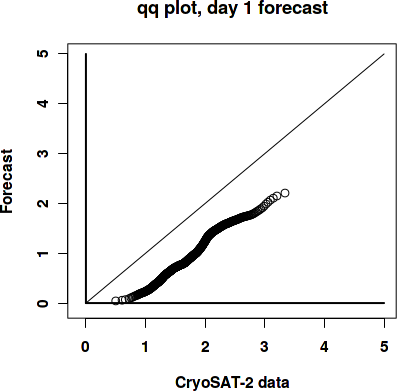
|

|
Sea ice thickness, day 1 forecast
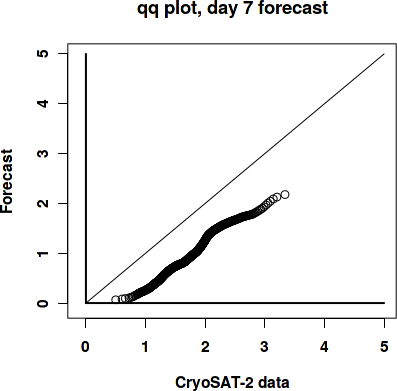
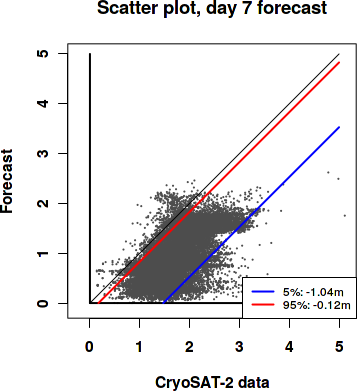
Day 7 forecast vs. observations
Contingency table
| observations | |||||||||
|---|---|---|---|---|---|---|---|---|---|
| open | c1 | c2 | c3 | c4 | c5 | c6 | |||
| m o d e l |
open | 0 | 0 | 0 | 0 | 0 | 0 | 0 | |
| c1 | 0 | 0.049 | 0.3 | 0.216 | 0.054 | 0.007 | 0.002 | ||
| c2 | 0 | 0 | 0.021 | 0.103 | 0.071 | 0.01 | 0.001 | ||
| c3 | 0 | 0 | 0.002 | 0.038 | 0.069 | 0.042 | 0.007 | ||
| c4 | 0 | 0 | 0.001 | 0.004 | 0.002 | 0.001 | 0.001 | ||
| c5 | 0 | 0 | 0 | 0 | 0 | 0 | 0 | ||
| c6 | 0 | 0 | 0 | 0 | 0 | 0 | 0 | ||
See category definitions for details.
Statistical distribution
|
|
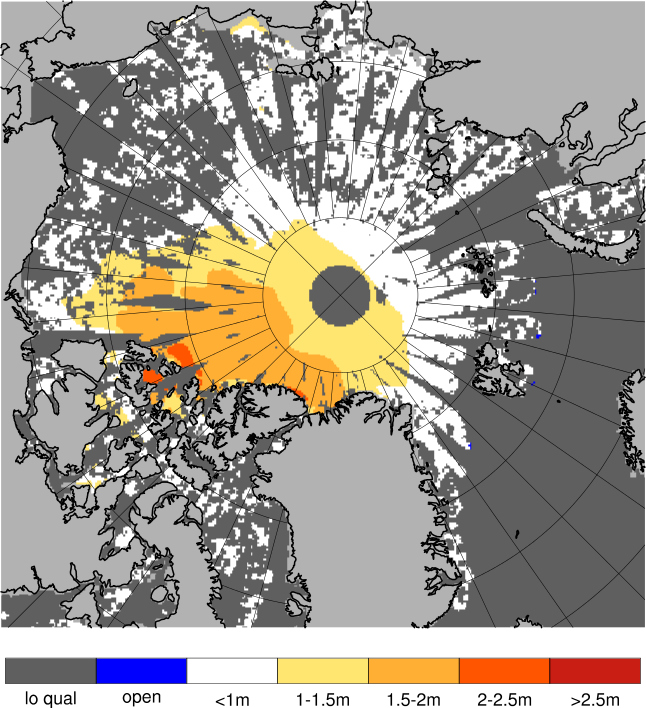
Sea ice thickness, day 7 forecast
Generated by /metno/routine/sms/V2/SIthickness/c2iceWebPage.sh Fri Jan 10 01:08:23 UTC 2020 on arcmfcval