Validation of ice thickness - Full domain
Bulletin date: 2019-12-19
Model: ARC MFC - TOPAZ
Data source: UCL CryoSAT-2 sea ice thickness
Validation statistics summary
| Bias (m) | RMS (m) | total grids | low SIT | OK SIT | high SIT | |
|---|---|---|---|---|---|---|
| Best estimate | -0.86 | 0.97 | 31026 | 15834 | 15167 | 25 |
| Day 1 forecast | -0.86 | 0.96 | 31026 | 15693 | 15309 | 24 |
| Day 4 forecast | -0.87 | 0.97 | 31026 | 15911 | 15094 | 21 |
| Day 7 forecast | -0.84 | 0.95 | 31026 | 15137 | 15862 | 27 |
| Day 10 forecast | -0.87 | 0.97 | 31026 | 15979 | 15022 | 25 |
Numbers in the three rightmost columns are grid counts. Regions with high/low sea ice thickness correspond to areas with model offsets from the gridded observations outside of one standard deviation. (Standard deviations are provided in the observational product.)
Definition of categories:
| Category | Sea ice thickness |
|---|---|
| c1 | <1m |
| c2 | 1 - 1.5m |
| c3 | 1.5 - 2m |
| c4 | 2 - 2.5m |
| c5 | 2.5 - 3m |
| c6 | >3m |
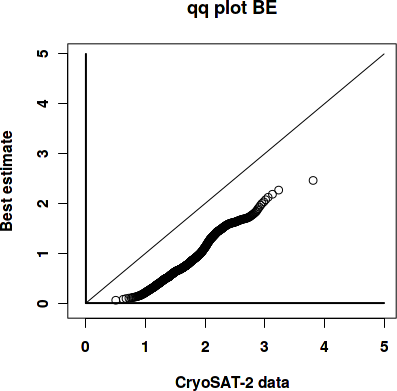
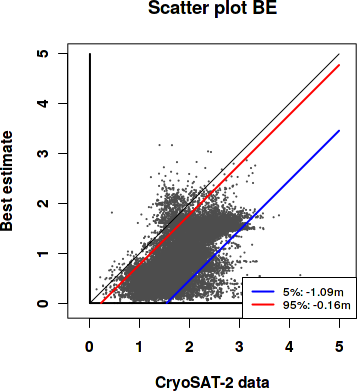
Best estimate vs. observations
Contingency table
| observations | |||||||||
|---|---|---|---|---|---|---|---|---|---|
| open | c1 | c2 | c3 | c4 | c5 | c6 | |||
| m o d e l |
open | 0 | 0 | 0 | 0 | 0 | 0 | 0 | |
| c1 | 0 | 0.051 | 0.284 | 0.241 | 0.071 | 0.01 | 0.002 | ||
| c2 | 0 | 0 | 0.009 | 0.076 | 0.091 | 0.015 | 0.001 | ||
| c3 | 0 | 0 | 0.003 | 0.035 | 0.055 | 0.041 | 0.004 | ||
| c4 | 0 | 0 | 0.001 | 0.005 | 0.003 | 0.001 | 0 | ||
| c5 | 0 | 0 | 0 | 0 | 0 | 0 | 0 | ||
| c6 | 0 | 0 | 0 | 0 | 0 | 0 | 0 | ||
See category definitions for details.
Statistical distribution
|
|
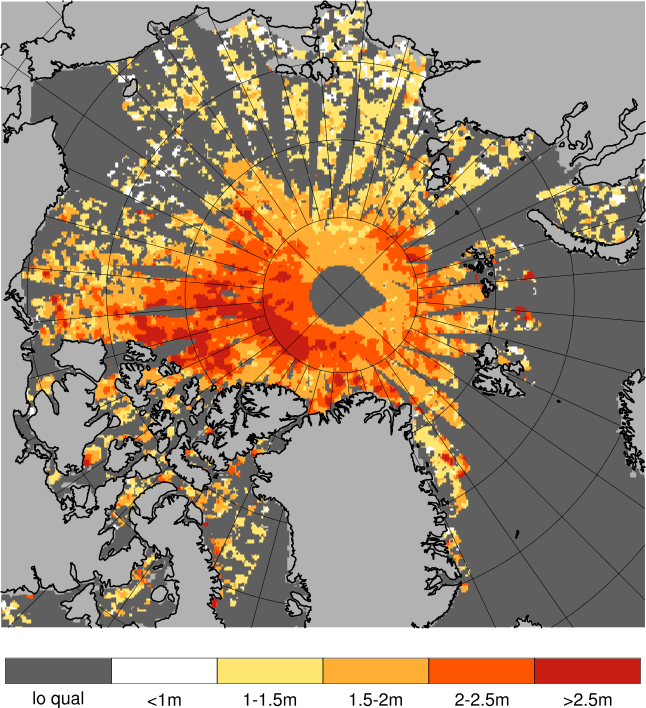
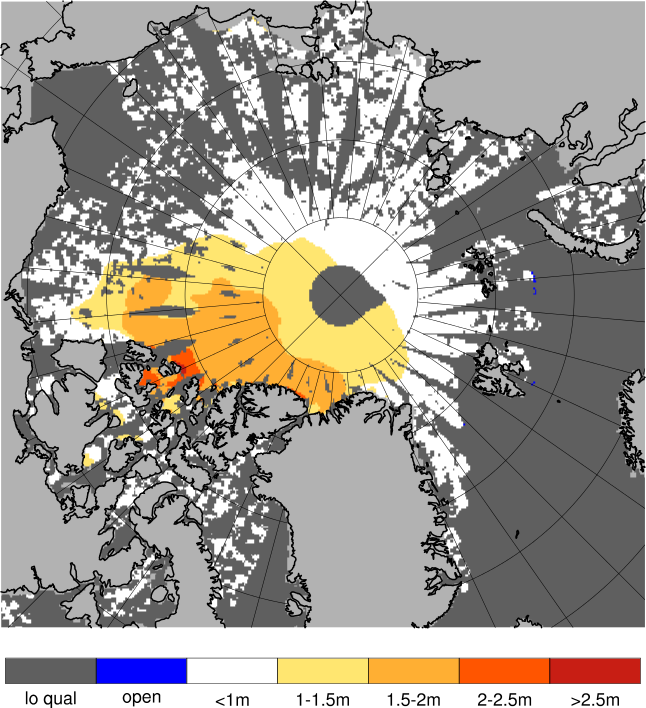
Observed sea ice thickness from CryoSAT
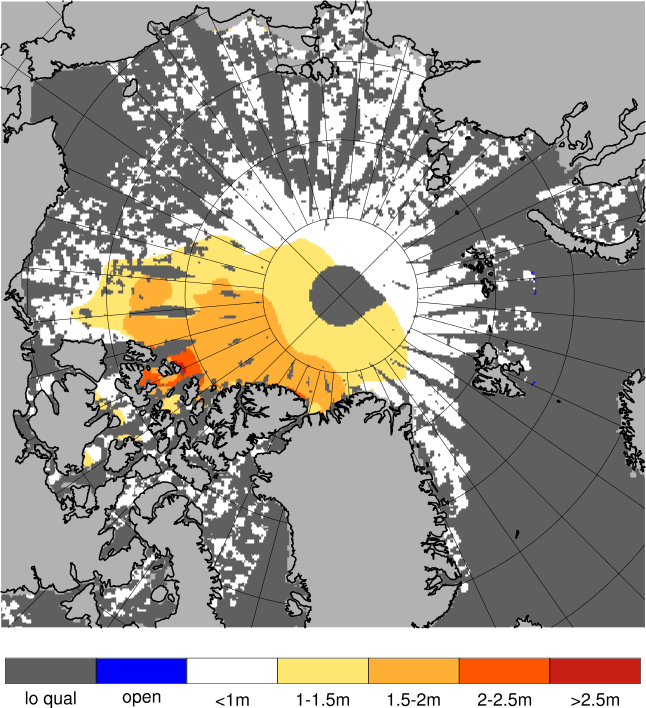
Sea ice thickness, best estimate product
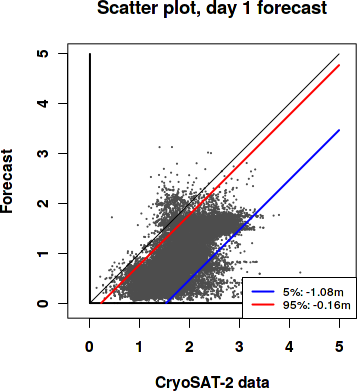
Day 1 forecast vs. observations
Contingency table
| observations | |||||||||
|---|---|---|---|---|---|---|---|---|---|
| open | c1 | c2 | c3 | c4 | c5 | c6 | |||
| m o d e l |
open | 0 | 0 | 0 | 0 | 0 | 0 | 0 | |
| c1 | 0 | 0.051 | 0.284 | 0.239 | 0.07 | 0.009 | 0.002 | ||
| c2 | 0 | 0 | 0.009 | 0.076 | 0.092 | 0.017 | 0.001 | ||
| c3 | 0 | 0 | 0.004 | 0.036 | 0.056 | 0.039 | 0.004 | ||
| c4 | 0 | 0 | 0.001 | 0.004 | 0.003 | 0.001 | 0 | ||
| c5 | 0 | 0 | 0 | 0 | 0 | 0 | 0 | ||
| c6 | 0 | 0 | 0 | 0 | 0 | 0 | 0 | ||
See category definitions for details.
Statistical distribution

|
|
Sea ice thickness, day 1 forecast
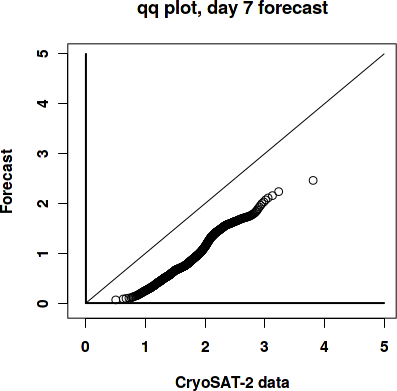
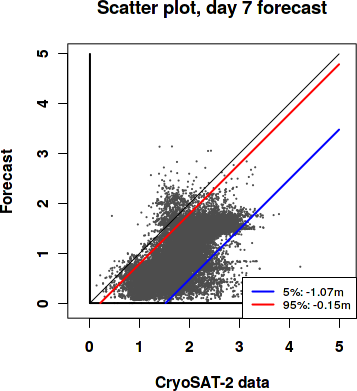
Day 7 forecast vs. observations
Contingency table
| observations | |||||||||
|---|---|---|---|---|---|---|---|---|---|
| open | c1 | c2 | c3 | c4 | c5 | c6 | |||
| m o d e l |
open | 0 | 0 | 0 | 0 | 0 | 0 | 0 | |
| c1 | 0 | 0.051 | 0.283 | 0.235 | 0.068 | 0.009 | 0.002 | ||
| c2 | 0 | 0 | 0.009 | 0.08 | 0.091 | 0.016 | 0.001 | ||
| c3 | 0 | 0 | 0.003 | 0.037 | 0.059 | 0.04 | 0.004 | ||
| c4 | 0 | 0 | 0.001 | 0.005 | 0.003 | 0.001 | 0 | ||
| c5 | 0 | 0 | 0 | 0 | 0 | 0 | 0 | ||
| c6 | 0 | 0 | 0 | 0 | 0 | 0 | 0 | ||
See category definitions for details.
Statistical distribution
|
|
Sea ice thickness, day 7 forecast

Generated by /metno/routine/sms/V2/SIthickness/c2iceWebPage.sh Fri Jan 3 01:08:39 UTC 2020 on arcmfcval