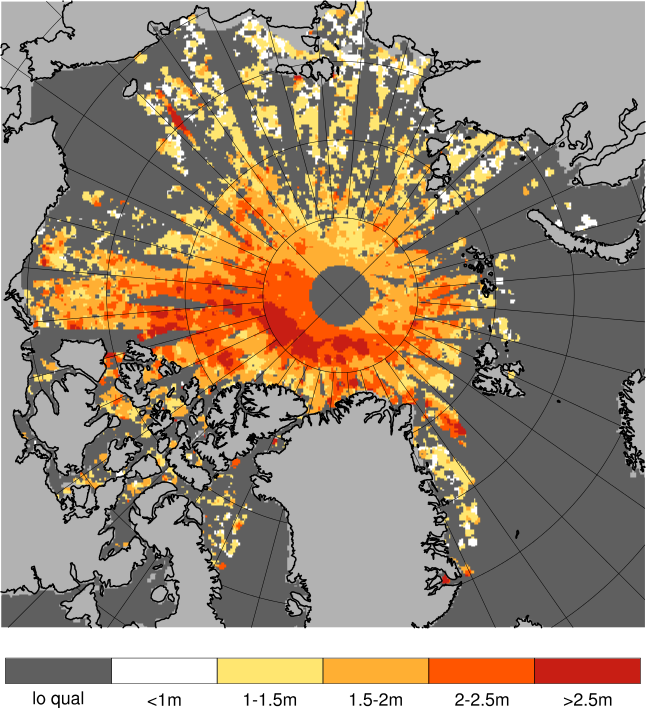
Validation of ice thickness - Full domain
Bulletin date: 2019-11-28
Model: ARC MFC - TOPAZ
Data source: UCL CryoSAT-2 sea ice thickness
Validation statistics summary
| Bias (m) | RMS (m) | total grids | low SIT | OK SIT | high SIT | |
|---|---|---|---|---|---|---|
| Best estimate | -0.89 | 0.98 | 27546 | 16350 | 11171 | 25 |
| Day 1 forecast | -0.88 | 0.97 | 27546 | 15956 | 11565 | 25 |
| Day 4 forecast | -0.89 | 0.98 | 27546 | 16120 | 11400 | 26 |
| Day 7 forecast | -0.86 | 0.95 | 27546 | 15419 | 12100 | 27 |
| Day 10 forecast | -0.86 | 0.95 | 27546 | 15373 | 12149 | 24 |
Numbers in the three rightmost columns are grid counts. Regions with high/low sea ice thickness correspond to areas with model offsets from the gridded observations outside of one standard deviation. (Standard deviations are provided in the observational product.)
Definition of categories:
| Category | Sea ice thickness |
|---|---|
| c1 | <1m |
| c2 | 1 - 1.5m |
| c3 | 1.5 - 2m |
| c4 | 2 - 2.5m |
| c5 | 2.5 - 3m |
| c6 | >3m |
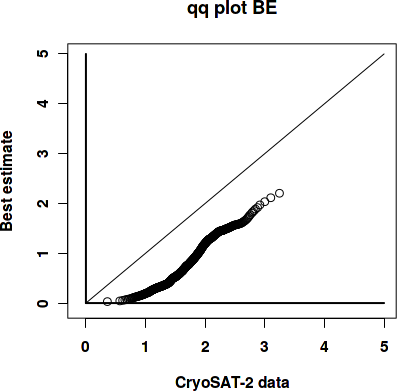
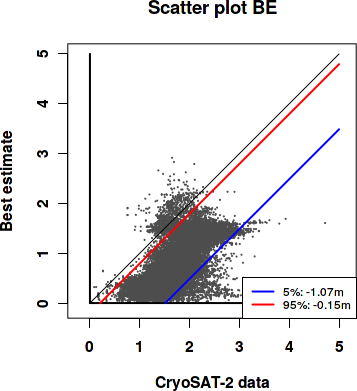
Best estimate vs. observations
Contingency table
| observations | |||||||||
|---|---|---|---|---|---|---|---|---|---|
| open | c1 | c2 | c3 | c4 | c5 | c6 | |||
| m o d e l |
open | 0 | 0 | 0 | 0 | 0 | 0 | 0 | |
| c1 | 0 | 0.072 | 0.281 | 0.243 | 0.056 | 0.006 | 0.002 | ||
| c2 | 0 | 0 | 0.011 | 0.09 | 0.115 | 0.033 | 0.002 | ||
| c3 | 0 | 0 | 0.006 | 0.026 | 0.037 | 0.01 | 0.001 | ||
| c4 | 0 | 0 | 0 | 0.004 | 0.001 | 0 | 0 | ||
| c5 | 0 | 0 | 0 | 0 | 0 | 0 | 0 | ||
| c6 | 0 | 0 | 0 | 0 | 0 | 0 | 0 | ||
See category definitions for details.
Statistical distribution
|
|
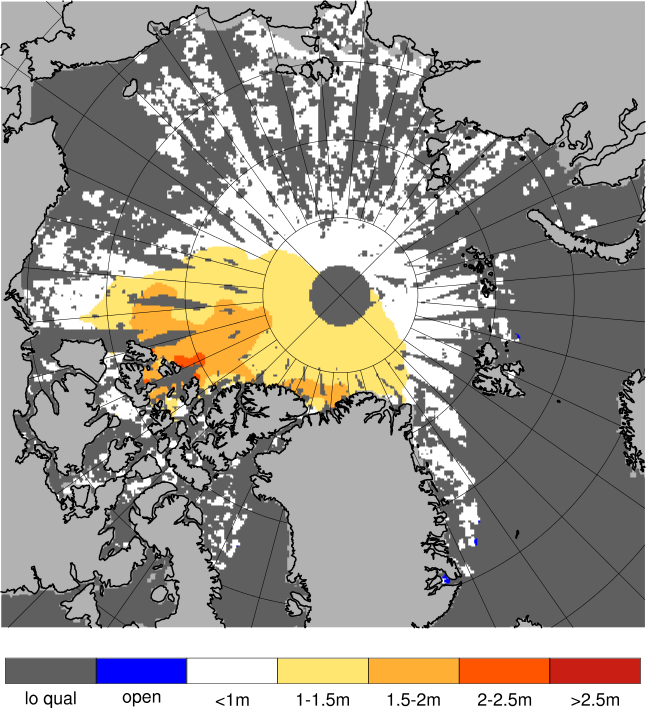
Observed sea ice thickness from CryoSAT
Sea ice thickness, best estimate product

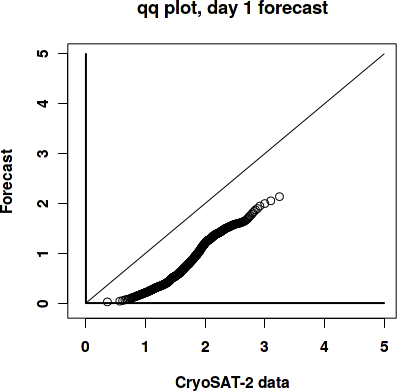
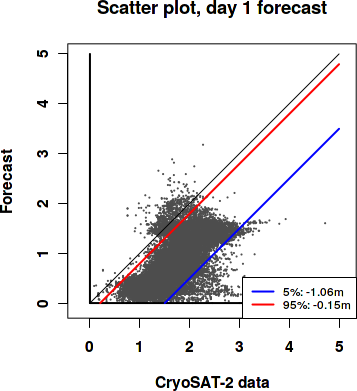
Day 1 forecast vs. observations
Contingency table
| observations | |||||||||
|---|---|---|---|---|---|---|---|---|---|
| open | c1 | c2 | c3 | c4 | c5 | c6 | |||
| m o d e l |
open | 0 | 0 | 0 | 0 | 0 | 0 | 0 | |
| c1 | 0 | 0.072 | 0.28 | 0.241 | 0.055 | 0.006 | 0.002 | ||
| c2 | 0 | 0 | 0.013 | 0.089 | 0.112 | 0.03 | 0.002 | ||
| c3 | 0 | 0 | 0.006 | 0.03 | 0.041 | 0.013 | 0.001 | ||
| c4 | 0 | 0 | 0 | 0.003 | 0.001 | 0 | 0 | ||
| c5 | 0 | 0 | 0 | 0 | 0 | 0 | 0 | ||
| c6 | 0 | 0 | 0 | 0 | 0 | 0 | 0 | ||
See category definitions for details.
Statistical distribution
|
|
Sea ice thickness, day 1 forecast
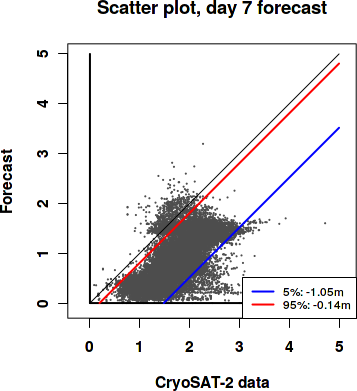
Day 7 forecast vs. observations
Contingency table
| observations | |||||||||
|---|---|---|---|---|---|---|---|---|---|
| open | c1 | c2 | c3 | c4 | c5 | c6 | |||
| m o d e l |
open | 0 | 0 | 0 | 0 | 0 | 0 | 0 | |
| c1 | 0 | 0.072 | 0.279 | 0.238 | 0.054 | 0.006 | 0.002 | ||
| c2 | 0 | 0 | 0.014 | 0.089 | 0.113 | 0.03 | 0.002 | ||
| c3 | 0 | 0 | 0.006 | 0.032 | 0.041 | 0.014 | 0.001 | ||
| c4 | 0 | 0 | 0 | 0.004 | 0.001 | 0 | 0 | ||
| c5 | 0 | 0 | 0 | 0 | 0 | 0 | 0 | ||
| c6 | 0 | 0 | 0 | 0 | 0 | 0 | 0 | ||
See category definitions for details.
Statistical distribution

|
|
Sea ice thickness, day 7 forecast

Generated by /metno/routine/sms/V2/SIthickness/c2iceWebPage.sh to. 19. des. 16:07:56 +0000 2019 on arcmfcval