Validation of ice thickness - Full domain
Bulletin date: 2019-11-21
Model: ARC MFC - TOPAZ
Data source: UCL CryoSAT-2 sea ice thickness
Validation statistics summary
| Bias (m) | RMS (m) | total grids | low SIT | OK SIT | high SIT | |
|---|---|---|---|---|---|---|
| Best estimate | -0.9 | 0.99 | 26188 | 16285 | 9888 | 15 |
| Day 1 forecast | -0.89 | 0.98 | 26188 | 15878 | 10297 | 13 |
| Day 4 forecast | -0.89 | 0.98 | 26188 | 15972 | 10204 | 12 |
| Day 7 forecast | -0.87 | 0.96 | 26188 | 15350 | 10823 | 15 |
| Day 10 forecast | -0.89 | 0.98 | 26188 | 15852 | 10323 | 13 |
Numbers in the three rightmost columns are grid counts. Regions with high/low sea ice thickness correspond to areas with model offsets from the gridded observations outside of one standard deviation. (Standard deviations are provided in the observational product.)
Definition of categories:
| Category | Sea ice thickness |
|---|---|
| c1 | <1m |
| c2 | 1 - 1.5m |
| c3 | 1.5 - 2m |
| c4 | 2 - 2.5m |
| c5 | 2.5 - 3m |
| c6 | >3m |
Best estimate vs. observations
Contingency table
| observations | |||||||||
|---|---|---|---|---|---|---|---|---|---|
| open | c1 | c2 | c3 | c4 | c5 | c6 | |||
| m o d e l |
open | 0 | 0 | 0.001 | 0 | 0 | 0 | 0 | |
| c1 | 0 | 0.07 | 0.271 | 0.234 | 0.065 | 0.005 | 0.001 | ||
| c2 | 0 | 0 | 0.015 | 0.087 | 0.124 | 0.04 | 0.002 | ||
| c3 | 0 | 0 | 0.006 | 0.023 | 0.031 | 0.015 | 0.002 | ||
| c4 | 0 | 0 | 0 | 0.004 | 0.002 | 0 | 0 | ||
| c5 | 0 | 0 | 0 | 0 | 0 | 0 | 0 | ||
| c6 | 0 | 0 | 0 | 0 | 0 | 0 | 0 | ||
See category definitions for details.
Statistical distribution
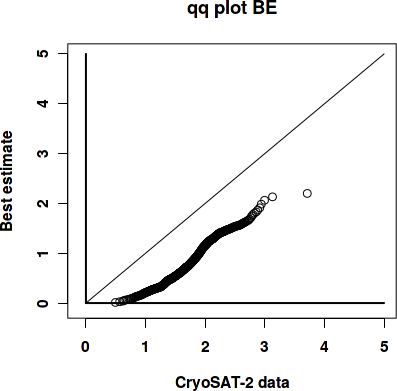
|
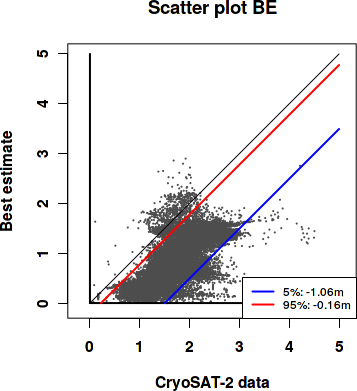
|
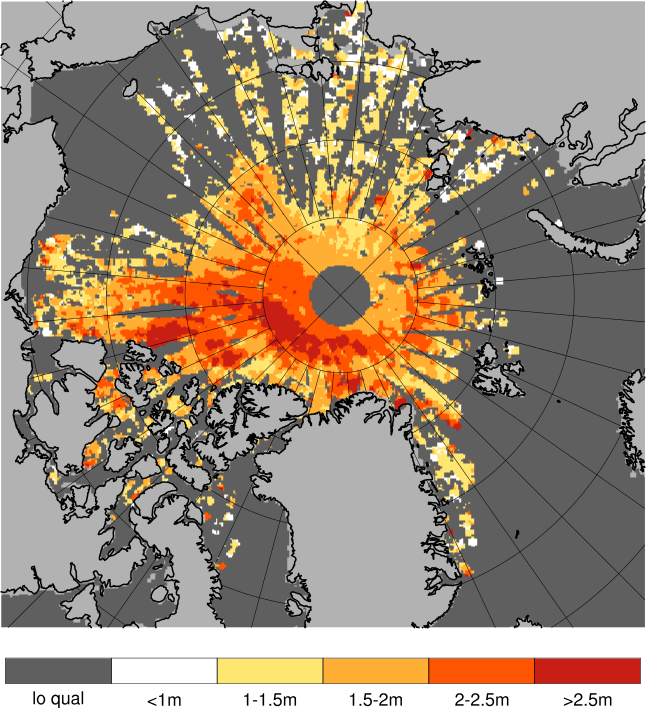
Observed sea ice thickness from CryoSAT
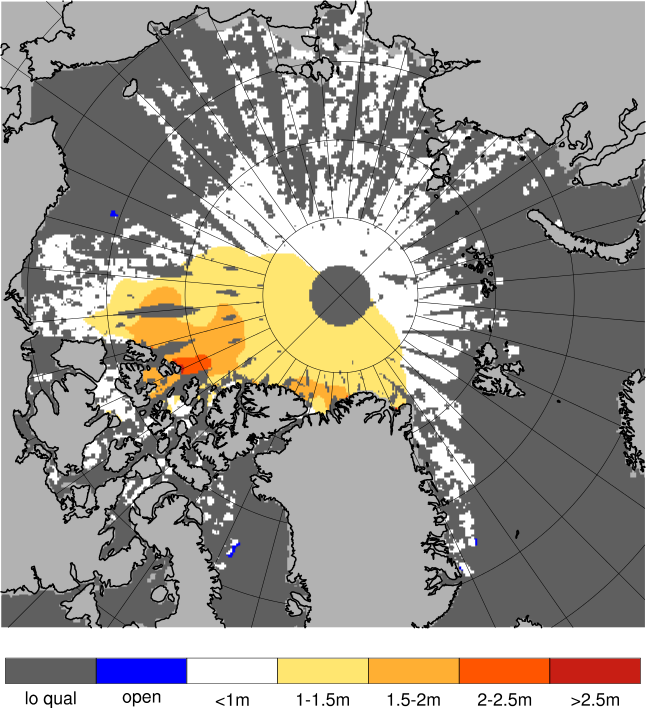
Sea ice thickness, best estimate product
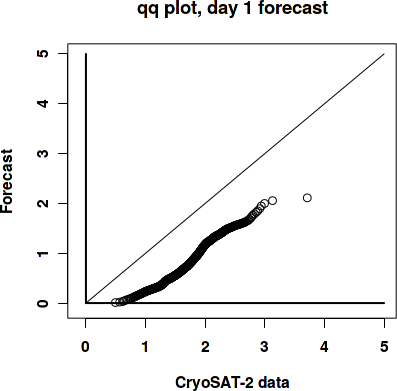
Day 1 forecast vs. observations
Contingency table
| observations | |||||||||
|---|---|---|---|---|---|---|---|---|---|
| open | c1 | c2 | c3 | c4 | c5 | c6 | |||
| m o d e l |
open | 0 | 0 | 0.001 | 0 | 0 | 0 | 0 | |
| c1 | 0 | 0.07 | 0.268 | 0.231 | 0.064 | 0.005 | 0.001 | ||
| c2 | 0 | 0 | 0.016 | 0.088 | 0.12 | 0.038 | 0.001 | ||
| c3 | 0 | 0 | 0.006 | 0.026 | 0.037 | 0.017 | 0.002 | ||
| c4 | 0 | 0 | 0 | 0.003 | 0.001 | 0 | 0 | ||
| c5 | 0 | 0 | 0 | 0 | 0 | 0 | 0 | ||
| c6 | 0 | 0 | 0 | 0 | 0 | 0 | 0 | ||
See category definitions for details.
Statistical distribution
|

|
Sea ice thickness, day 1 forecast

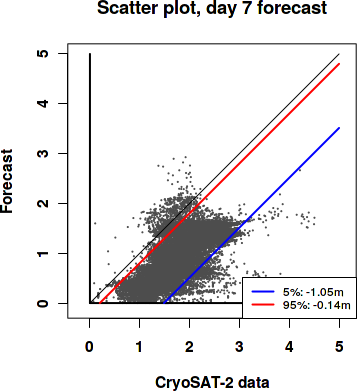
Day 7 forecast vs. observations
Contingency table
| observations | |||||||||
|---|---|---|---|---|---|---|---|---|---|
| open | c1 | c2 | c3 | c4 | c5 | c6 | |||
| m o d e l |
open | 0 | 0 | 0.001 | 0 | 0 | 0 | 0 | |
| c1 | 0 | 0.07 | 0.267 | 0.228 | 0.063 | 0.005 | 0.001 | ||
| c2 | 0 | 0 | 0.017 | 0.09 | 0.12 | 0.037 | 0.001 | ||
| c3 | 0 | 0 | 0.007 | 0.027 | 0.038 | 0.018 | 0.002 | ||
| c4 | 0 | 0 | 0 | 0.004 | 0.001 | 0 | 0 | ||
| c5 | 0 | 0 | 0 | 0 | 0 | 0 | 0 | ||
| c6 | 0 | 0 | 0 | 0 | 0 | 0 | 0 | ||
See category definitions for details.
Statistical distribution

|
|
Sea ice thickness, day 7 forecast

Generated by /metno/routine/sms/V2/SIthickness/c2iceWebPage.sh Fri Dec 6 01:08:43 UTC 2019 on arcmfcval