Validation of ice thickness - Full domain
Bulletin date: 2019-10-31
Model: ARC MFC - TOPAZ
Data source: UCL CryoSAT-2 sea ice thickness
Validation statistics summary
| Bias (m) | RMS (m) | total grids | low SIT | OK SIT | high SIT | |
|---|---|---|---|---|---|---|
| Best estimate | -0.75 | 0.87 | 19379 | 10496 | 8788 | 95 |
| Day 1 forecast | -0.75 | 0.87 | 19379 | 10413 | 8884 | 82 |
| Day 4 forecast | -0.75 | 0.87 | 19379 | 10515 | 8785 | 79 |
| Day 7 forecast | -0.74 | 0.86 | 19379 | 10290 | 9012 | 77 |
| Day 10 forecast | -0.76 | 0.88 | 19379 | 10591 | 8707 | 81 |
Numbers in the three rightmost columns are grid counts. Regions with high/low sea ice thickness correspond to areas with model offsets from the gridded observations outside of one standard deviation. (Standard deviations are provided in the observational product.)
Definition of categories:
| Category | Sea ice thickness |
|---|---|
| c1 | <1m |
| c2 | 1 - 1.5m |
| c3 | 1.5 - 2m |
| c4 | 2 - 2.5m |
| c5 | 2.5 - 3m |
| c6 | >3m |
Best estimate vs. observations
Contingency table
| observations | |||||||||
|---|---|---|---|---|---|---|---|---|---|
| open | c1 | c2 | c3 | c4 | c5 | c6 | |||
| m o d e l |
open | 0 | 0 | 0 | 0 | 0 | 0 | 0 | |
| c1 | 0 | 0.047 | 0.313 | 0.226 | 0.022 | 0.004 | 0.002 | ||
| c2 | 0 | 0.002 | 0.055 | 0.123 | 0.119 | 0.02 | 0 | ||
| c3 | 0 | 0.001 | 0.02 | 0.029 | 0.01 | 0.002 | 0.001 | ||
| c4 | 0 | 0 | 0.004 | 0.001 | 0 | 0 | 0 | ||
| c5 | 0 | 0 | 0 | 0 | 0 | 0 | 0 | ||
| c6 | 0 | 0 | 0 | 0 | 0 | 0 | 0 | ||
See category definitions for details.
Statistical distribution
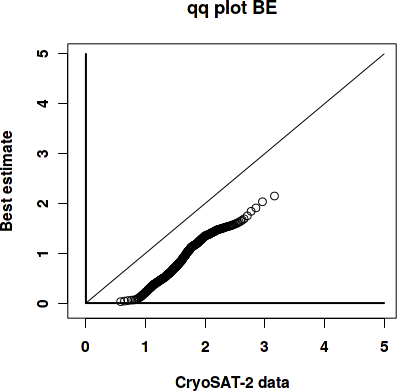
|
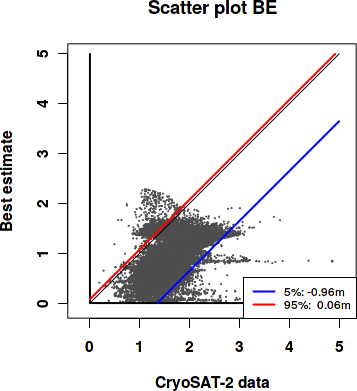
|
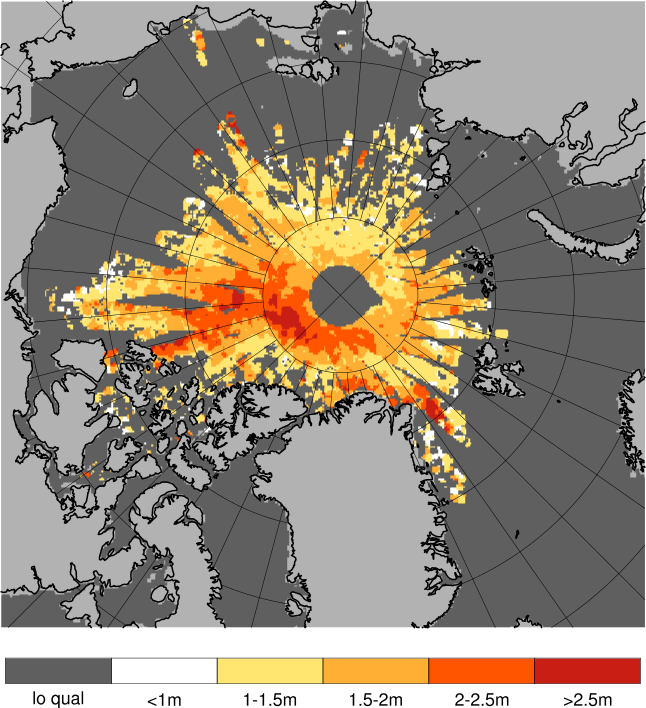
Observed sea ice thickness from CryoSAT
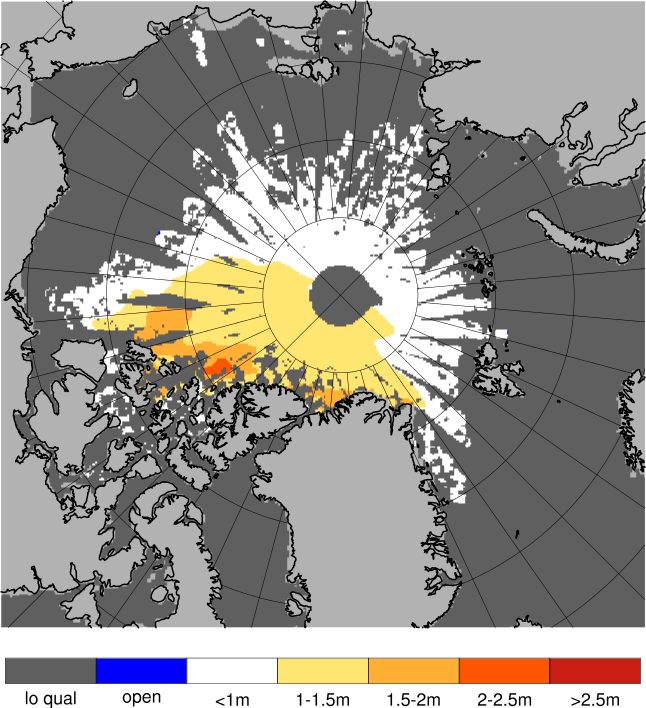
Sea ice thickness, best estimate product
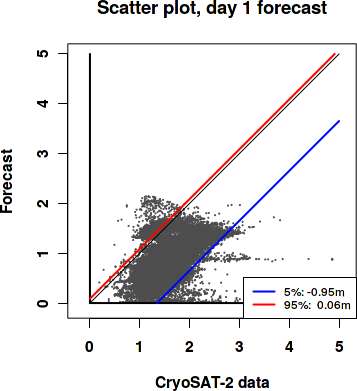
Day 1 forecast vs. observations
Contingency table
| observations | |||||||||
|---|---|---|---|---|---|---|---|---|---|
| open | c1 | c2 | c3 | c4 | c5 | c6 | |||
| m o d e l |
open | 0 | 0 | 0 | 0 | 0 | 0 | 0 | |
| c1 | 0 | 0.047 | 0.312 | 0.223 | 0.021 | 0.004 | 0.002 | ||
| c2 | 0 | 0.002 | 0.051 | 0.116 | 0.117 | 0.02 | 0 | ||
| c3 | 0 | 0.001 | 0.025 | 0.039 | 0.013 | 0.003 | 0.001 | ||
| c4 | 0 | 0 | 0.003 | 0 | 0 | 0 | 0 | ||
| c5 | 0 | 0 | 0 | 0 | 0 | 0 | 0 | ||
| c6 | 0 | 0 | 0 | 0 | 0 | 0 | 0 | ||
See category definitions for details.
Statistical distribution

|
|
Sea ice thickness, day 1 forecast

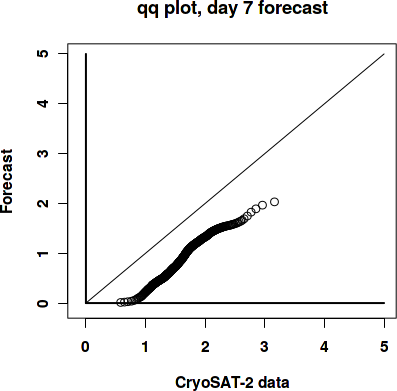
Day 7 forecast vs. observations
Contingency table
| observations | |||||||||
|---|---|---|---|---|---|---|---|---|---|
| open | c1 | c2 | c3 | c4 | c5 | c6 | |||
| m o d e l |
open | 0 | 0 | 0.001 | 0.001 | 0 | 0 | 0 | |
| c1 | 0 | 0.047 | 0.31 | 0.22 | 0.019 | 0.004 | 0.002 | ||
| c2 | 0 | 0.002 | 0.052 | 0.118 | 0.119 | 0.021 | 0.001 | ||
| c3 | 0 | 0.001 | 0.025 | 0.039 | 0.013 | 0.002 | 0 | ||
| c4 | 0 | 0 | 0.003 | 0 | 0 | 0 | 0 | ||
| c5 | 0 | 0 | 0 | 0 | 0 | 0 | 0 | ||
| c6 | 0 | 0 | 0 | 0 | 0 | 0 | 0 | ||
See category definitions for details.
Statistical distribution
|

|
Sea ice thickness, day 7 forecast

Generated by /metno/routine/sms/V2/SIthickness/c2iceWebPage.sh Fri Nov 15 01:09:19 UTC 2019 on arcmfcval