Validation of ice thickness - Full domain
Bulletin date: 2019-10-24
Model: ARC MFC - TOPAZ
Data source: UCL CryoSAT-2 sea ice thickness
Validation statistics summary
| Bias (m) | RMS (m) | total grids | low SIT | OK SIT | high SIT | |
|---|---|---|---|---|---|---|
| Best estimate | -0.72 | 0.85 | 17048 | 9007 | 7927 | 114 |
| Day 1 forecast | -0.72 | 0.84 | 17048 | 8825 | 8127 | 96 |
| Day 4 forecast | -0.72 | 0.85 | 17048 | 8879 | 8073 | 96 |
| Day 7 forecast | -0.71 | 0.84 | 17048 | 8761 | 8193 | 94 |
| Day 10 forecast | -0.72 | 0.85 | 17048 | 8833 | 8129 | 86 |
Numbers in the three rightmost columns are grid counts. Regions with high/low sea ice thickness correspond to areas with model offsets from the gridded observations outside of one standard deviation. (Standard deviations are provided in the observational product.)
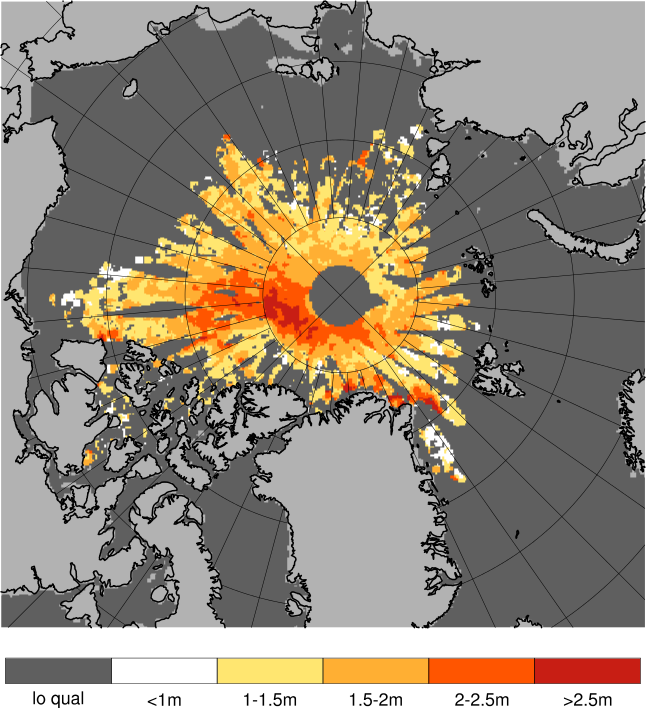
Definition of categories:
| Category | Sea ice thickness |
|---|---|
| c1 | <1m |
| c2 | 1 - 1.5m |
| c3 | 1.5 - 2m |
| c4 | 2 - 2.5m |
| c5 | 2.5 - 3m |
| c6 | >3m |
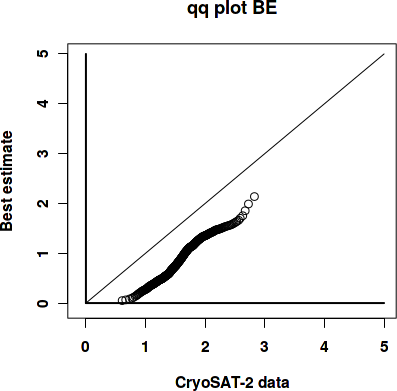
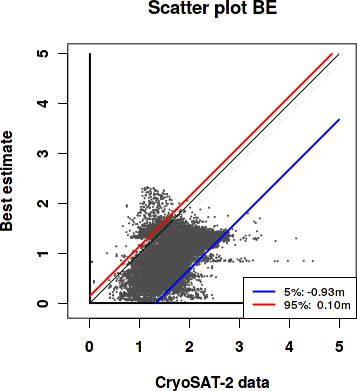
Best estimate vs. observations
Contingency table
| observations | |||||||||
|---|---|---|---|---|---|---|---|---|---|
| open | c1 | c2 | c3 | c4 | c5 | c6 | |||
| m o d e l |
open | 0 | 0 | 0 | 0 | 0 | 0 | 0 | |
| c1 | 0 | 0.054 | 0.293 | 0.241 | 0.019 | 0.002 | 0.001 | ||
| c2 | 0 | 0.004 | 0.065 | 0.127 | 0.111 | 0.021 | 0.001 | ||
| c3 | 0 | 0.001 | 0.026 | 0.026 | 0.004 | 0 | 0 | ||
| c4 | 0 | 0 | 0.005 | 0.001 | 0 | 0 | 0 | ||
| c5 | 0 | 0 | 0 | 0 | 0 | 0 | 0 | ||
| c6 | 0 | 0 | 0 | 0 | 0 | 0 | 0 | ||
See category definitions for details.
Statistical distribution
|
|
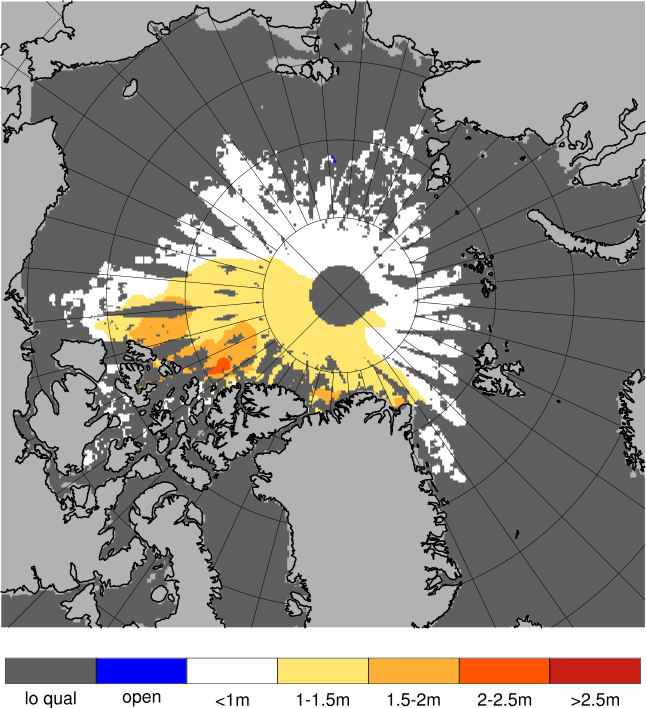
Observed sea ice thickness from CryoSAT
Sea ice thickness, best estimate product

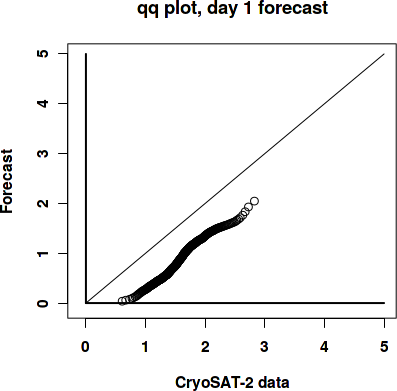
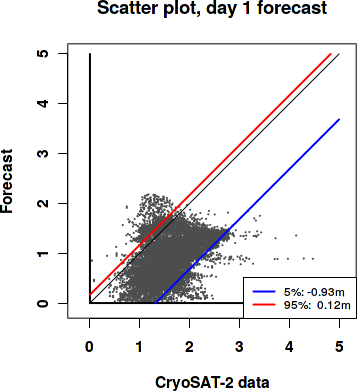
Day 1 forecast vs. observations
Contingency table
| observations | |||||||||
|---|---|---|---|---|---|---|---|---|---|
| open | c1 | c2 | c3 | c4 | c5 | c6 | |||
| m o d e l |
open | 0 | 0 | 0 | 0 | 0 | 0 | 0 | |
| c1 | 0 | 0.054 | 0.292 | 0.234 | 0.019 | 0.002 | 0.001 | ||
| c2 | 0 | 0.004 | 0.059 | 0.126 | 0.109 | 0.021 | 0.001 | ||
| c3 | 0 | 0.001 | 0.035 | 0.034 | 0.005 | 0 | 0 | ||
| c4 | 0 | 0 | 0.003 | 0 | 0 | 0 | 0 | ||
| c5 | 0 | 0 | 0 | 0 | 0 | 0 | 0 | ||
| c6 | 0 | 0 | 0 | 0 | 0 | 0 | 0 | ||
See category definitions for details.
Statistical distribution
|
|
Sea ice thickness, day 1 forecast

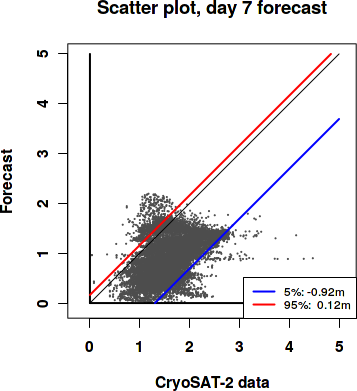
Day 7 forecast vs. observations
Contingency table
| observations | |||||||||
|---|---|---|---|---|---|---|---|---|---|
| open | c1 | c2 | c3 | c4 | c5 | c6 | |||
| m o d e l |
open | 0 | 0 | 0 | 0 | 0 | 0 | 0 | |
| c1 | 0 | 0.053 | 0.29 | 0.236 | 0.018 | 0.001 | 0.001 | ||
| c2 | 0 | 0.004 | 0.06 | 0.125 | 0.112 | 0.021 | 0.001 | ||
| c3 | 0 | 0.001 | 0.035 | 0.033 | 0.005 | 0.001 | 0 | ||
| c4 | 0 | 0 | 0.003 | 0.001 | 0 | 0 | 0 | ||
| c5 | 0 | 0 | 0 | 0 | 0 | 0 | 0 | ||
| c6 | 0 | 0 | 0 | 0 | 0 | 0 | 0 | ||
See category definitions for details.
Statistical distribution

|
|
Sea ice thickness, day 7 forecast
Generated by /metno/routine/sms/V2/SIthickness/c2iceWebPage.sh Fri Nov 8 01:03:46 UTC 2019 on arcmfcval