Validation of ice thickness - Full domain
Bulletin date: 2019-05-23
Model: ARC MFC - TOPAZ
Data source: UCL CryoSAT-2 sea ice thickness
Validation statistics summary
| Bias (m) | RMS (m) | total grids | low SIT | OK SIT | high SIT | |
|---|---|---|---|---|---|---|
| Best estimate | -1.13 | 1.26 | 33417 | 16460 | 16909 | 48 |
| Day 1 forecast | -1.13 | 1.26 | 33417 | 16497 | 16873 | 47 |
| Day 4 forecast | -1.13 | 1.26 | 33417 | 16479 | 16892 | 46 |
| Day 7 forecast | -1.14 | 1.27 | 33417 | 16487 | 16882 | 48 |
| Day 10 forecast | -1.14 | 1.27 | 33417 | 16584 | 16786 | 47 |
Numbers in the three rightmost columns are grid counts. Regions with high/low sea ice thickness correspond to areas with model offsets from the gridded observations outside of one standard deviation. (Standard deviations are provided in the observational product.)
Definition of categories:
| Category | Sea ice thickness |
|---|---|
| c1 | <1m |
| c2 | 1 - 1.5m |
| c3 | 1.5 - 2m |
| c4 | 2 - 2.5m |
| c5 | 2.5 - 3m |
| c6 | >3m |
Best estimate vs. observations
Contingency table
| observations | |||||||||
|---|---|---|---|---|---|---|---|---|---|
| open | c1 | c2 | c3 | c4 | c5 | c6 | |||
| m o d e l |
open | 0 | 0 | 0 | 0 | 0 | 0 | 0 | |
| c1 | 0 | 0.003 | 0.036 | 0.096 | 0.054 | 0.018 | 0.017 | ||
| c2 | 0 | 0.001 | 0.005 | 0.048 | 0.126 | 0.088 | 0.027 | ||
| c3 | 0 | 0 | 0.002 | 0.016 | 0.072 | 0.142 | 0.084 | ||
| c4 | 0 | 0 | 0 | 0.001 | 0.009 | 0.04 | 0.07 | ||
| c5 | 0 | 0 | 0 | 0 | 0.001 | 0.003 | 0.033 | ||
| c6 | 0 | 0 | 0 | 0 | 0 | 0 | 0.006 | ||
See category definitions for details.
Statistical distribution
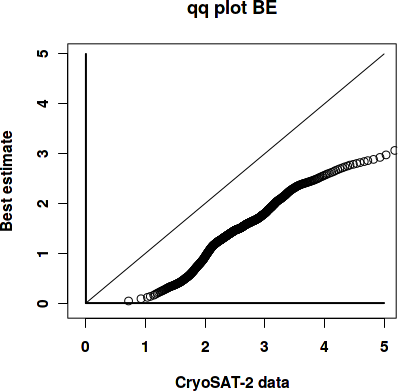
|
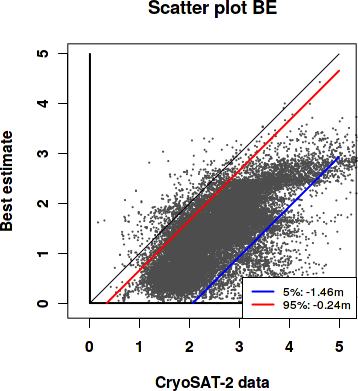
|
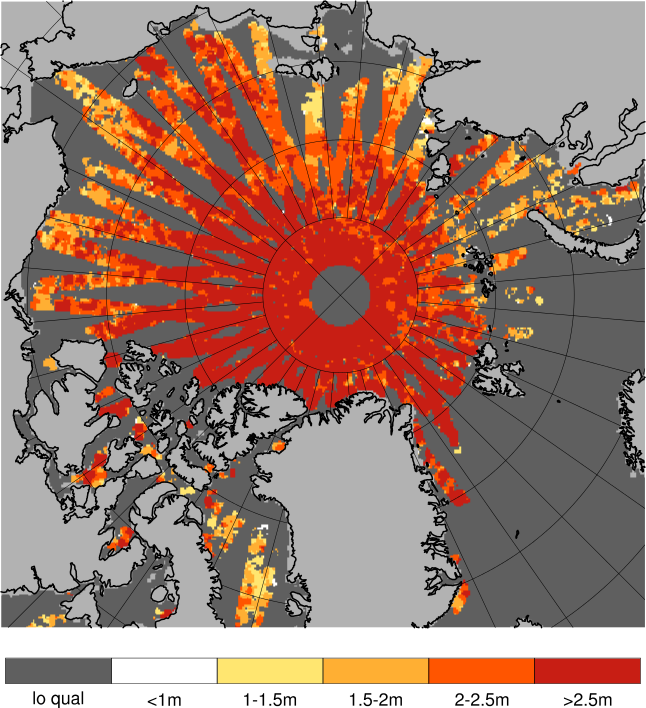
Observed sea ice thickness from CryoSAT
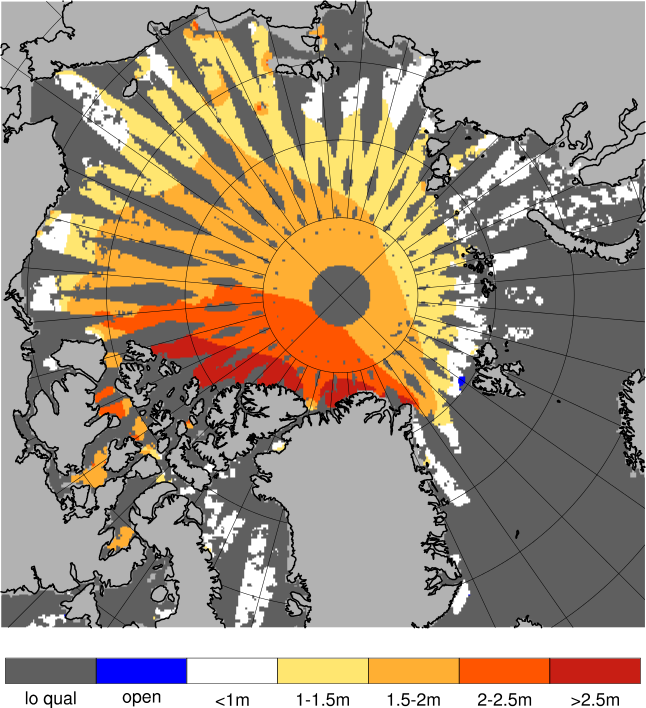
Sea ice thickness, best estimate product
Day 1 forecast vs. observations
Contingency table
| observations | |||||||||
|---|---|---|---|---|---|---|---|---|---|
| open | c1 | c2 | c3 | c4 | c5 | c6 | |||
| m o d e l |
open | 0 | 0 | 0 | 0 | 0 | 0 | 0.001 | |
| c1 | 0 | 0.003 | 0.036 | 0.095 | 0.053 | 0.018 | 0.017 | ||
| c2 | 0 | 0.001 | 0.005 | 0.048 | 0.128 | 0.089 | 0.027 | ||
| c3 | 0 | 0 | 0.002 | 0.015 | 0.071 | 0.142 | 0.085 | ||
| c4 | 0 | 0 | 0 | 0.001 | 0.009 | 0.041 | 0.07 | ||
| c5 | 0 | 0 | 0 | 0 | 0.001 | 0.003 | 0.033 | ||
| c6 | 0 | 0 | 0 | 0 | 0 | 0 | 0.006 | ||
See category definitions for details.
Statistical distribution
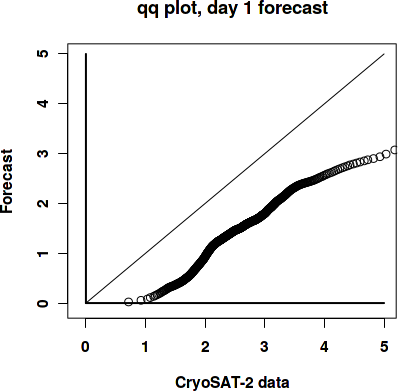
|
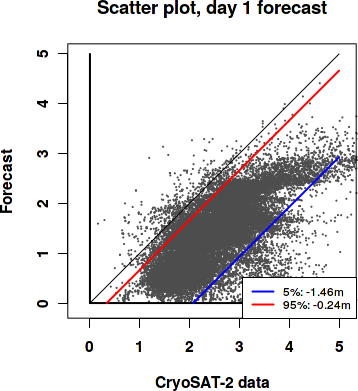
|
Sea ice thickness, day 1 forecast

Day 7 forecast vs. observations
Contingency table
| observations | |||||||||
|---|---|---|---|---|---|---|---|---|---|
| open | c1 | c2 | c3 | c4 | c5 | c6 | |||
| m o d e l |
open | 0 | 0 | 0 | 0 | 0.001 | 0 | 0.001 | |
| c1 | 0 | 0.003 | 0.036 | 0.095 | 0.053 | 0.017 | 0.017 | ||
| c2 | 0 | 0.001 | 0.005 | 0.048 | 0.127 | 0.087 | 0.026 | ||
| c3 | 0 | 0 | 0.002 | 0.015 | 0.071 | 0.144 | 0.085 | ||
| c4 | 0 | 0 | 0 | 0.001 | 0.009 | 0.04 | 0.07 | ||
| c5 | 0 | 0 | 0 | 0 | 0.001 | 0.003 | 0.033 | ||
| c6 | 0 | 0 | 0 | 0 | 0 | 0 | 0.006 | ||
See category definitions for details.
Statistical distribution
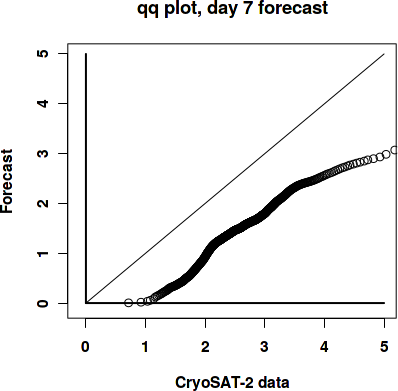
|
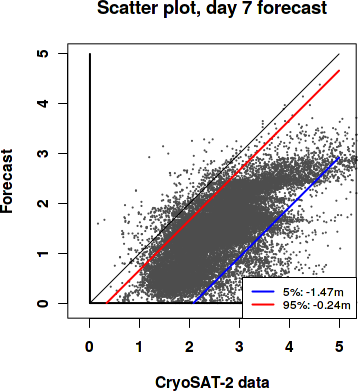
|
Sea ice thickness, day 7 forecast

Generated by /metno/routine/sms/V2/SIthickness/c2iceWebPage.sh Fri Jun 7 01:04:15 UTC 2019 on arcmfcval